


General Information
Related Benchmark: MAFS.912.F-IF.2.5
Reporting Category: Functions: Interpreting Functions
Type: MC: Multiple Choice
Difficulty: N/A
Question:
The points on the graph show the population data, in millions, of the state of Florida for each decade from 1900 to 2000. The data are modeled by the function P(x)= , shown on the graph.
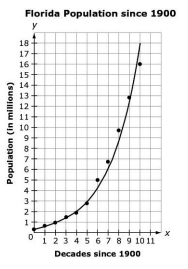
What is the domain of the graph of P(x) that is shown?
Answer Options:
A. 
B.
C. all whole numbers
D. 
Answer Key:
D

