Sample Test Item Preview


This document was generated on CPALMS - www.cpalms.org


General Information

Related Standards: MAFS.912.F-IF.2.5
Reporting Category: Functions: Interpreting Functions
Type: MC: Multiple Choice
Difficulty: N/A
Question:

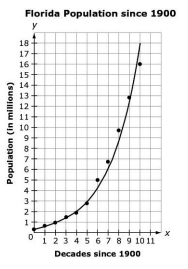
The points on the graph show the population data, in millions, of the state of Florida for each decade from 1900 to 2000. The data are modeled by the function P(x)=begin mathsize 12px style 506975 left parenthesis 1.43 right parenthesis to the power of x end style, shown on the graph.

What is the domain of the graph of P(x) that is shown?

Answer Options:

A. begin mathsize 12px style x greater or equal than 0 end style

B.begin mathsize 12px style 1900 less or equal than x less or equal than 2000 end style

C. all whole numbers

D. begin mathsize 12px style 0 less or equal than x less or equal than 10 end style

Answer Key:
D

Aligned Standards

Code Description
MAFS.912.F-IF.2.5: Relate the domain of a function to its graph and, where applicable, to the quantitative relationship it describes. For example, if the function h(n) gives the number of person-hours it takes to assemble engines in a factory, then the positive integers would be an appropriate domain for the function.


Printed On:4/28/2024 12:07:39 PM
Print Page | Close this window