General Information
Related Benchmark: MAFS.912.S-ID.1.1
Reporting Category: Statistics & Probability: Interpreting Categorical & Quantitative Data
Type: GRID: Graphic Response Item Display
Difficulty: N/A
Question:
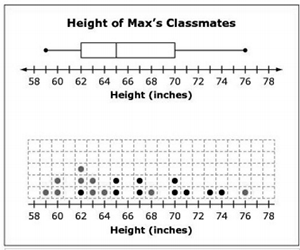
Max collected data on the height of each of his 20 classmates. The box plot shown represents his data.
Click above the number line to complete the dot plot that could also represent these data.
Possible Answer: