General Information
Related Benchmark: MAFS.912.F-LE.2.5
Reporting Category: Functions: Linear, Quadratic, & Exponential Models
Type: GRID: Graphic Response Item Display
Difficulty: N/A
Question:
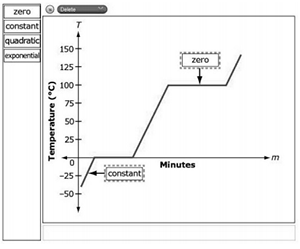
The graph shows T, the temperature of water, in degrees Celsius, in a test tube after m minutes of an experiment.
Drag a label to each box to correctly identify the type of rate of change between temperature and time on each part of the graph.
Possible Answer: