


Perform hypothesis tests of means and proportions for large samples, using simulations to determine whether a sample mean (proportion) has a low likelihood of occurring.
Remarks
Example: A student wants to determine whether a certain coin is fair. She flips it 20 times, and notes that it came up heads 65% of the time (13 times out of 20). A computer simulation of the same experiment with a fair coin, repeated 100 times, yielded varying results, shown in the histogram below. How many of the 100 experiments done by the computer resulted in 65% or more heads?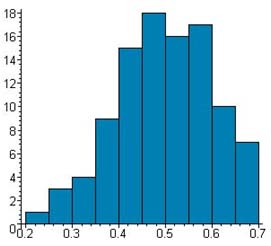
General Information
Subject Area: X-Mathematics (former standards - 2008)
Grade: 912
Body of Knowledge: Statistics
Idea: Level 3: Strategic Thinking & Complex Reasoning
Standard: Interpreting Results - Gather data and determine confidence intervals to make inferences about means, and use hypothesis tests to make decisions. Learn to use data to approximate p-values and to determine whether correlations between variables are significant.
Date Adopted or Revised: 09/07
Content Complexity Rating:
Level 3: Strategic Thinking & Complex Reasoning
-
More Information
Date of Last Rating: 06/07
Status: State Board Approved - Archived
Related Access Points
Alternate version of this benchmark for students with significant cognitive disabilities.
Related Resources
Vetted resources educators can use to teach the concepts and skills in this benchmark.
Student Resources
Vetted resources students can use to learn the concepts and skills in this benchmark.
Parent Resources
Vetted resources caregivers can use to help students learn the concepts and skills in this benchmark.

