


General Information
Related Benchmark: MA.8.A.1.6
Reporting Category: Algebra
Type: MC: Multiple Choice
Difficulty: N/A
Question:
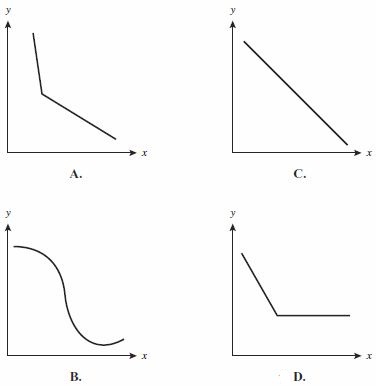
In a certain city, the number of new houses built each month during the first half of the year decreased at a constant rate. During the second half of the year, the number of new houses built each month remained the same. Which graph best illustrates the number of houses built each month in this city?
Answer Options:
Answer Key:
D
Item Context:
Social Studies/Consumerism

