


General Information
Related Benchmark: MA.5.S.7.2
Reporting Category: Statistics
Type: MC: Multiple Choice
Difficulty: N/A
Question:
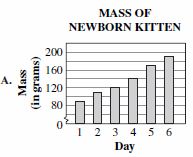
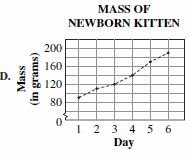
A veterinarian measured the mass of a newborn kitten each day for 6 days. The results are shown in the table below.
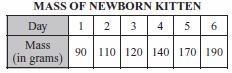
Which graph is the best representation of the data in the table?
Answer Options:

Answer Key:
D
Item Context:
Science

