


General Information
Related Benchmark: MAFS.8.SP.1.1
Reporting Category: Statistics & Probability
Type: MS: Multiselect
Difficulty: N/A
Question:
A scatter plot is shown for bottled water sales and temperature.
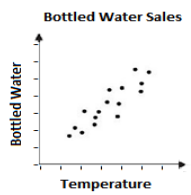
Select all statements that correctly interpret the graph.
Answer Options:
A. There are no outliers for the data
B. The data show a linear association
C. The data show a positive correlation
D. The data show a negative correlation
E. The data show no relation between bottled water sales and temperature

