Connecting Benchmarks/Horizontal Alignment
Terms from the K-12 Glossary
- Transformation
- Translation
Vertical Alignment
Previous Benchmarks
Next Benchmarks
Purpose and Instructional Strategies
In grade 8, students performed single transformations on two-dimensional figures. In Algebra I, students identify the effects of single transformations on linear, quadratic and absolute value functions. In Geometry, students will perform multiple transformations on two-dimensional figures. In later courses, student will work with transformations of many types of functions.
- In this benchmark, students will examine the impact of transformations on linear, quadratic, and absolute value functions. Instruction includes the use of graphing software to ensure adequate time for students to examine multiple transformations on the graphs of functions.
- Have students use graphing technology to explore different parent functions.
- In each graph, toggle on/off the graphs for f(x) + k, kf(x), f(kx) and f(x + x) to examine their impacts on the function. Use the slider to change the value of k (be sure to examine the impacts when k is positive and negative).
- As students explore, prompt discussion (MTR.4.1) among them about the patterns they see as they adjust the slider (MTR.5.1).
- For f(x) + k, students should discover that k is being added to the output of the function (equivalent to the y-value) and will therefore result in a vertical translation of the function by k units.
- Ask students to describe what values of k cause the graph to shift up. Which values cause it to shift down?
- For kf(x), students should discover that k is being multiplied by the output of the function (equivalent to the y-value) and will therefore result in a vertical dilation (stretch/compression) of the function by a factor of k.
- Ask students to describe what values of k cause the graph to stretch up vertically. Which values cause it to compress? Which values for k cause the graph to reflect over the x-axis? What is the significance of k = −1?
- For f(x + k), students should discover that k is being added to the input of the function and will therefore result in a horizontal translation of the function by −k units.
- Ask students to describe what values of k cause the graph to shift left. Which values cause it to shift right?
- For f(kx), students should discover that k is being multiplied by the input of the function and will therefore result in a horizontal dilation (stretch/compression) of the function by a factor of k.
- Ask students to describe what values of k cause the graph to stretch horizontally. Which values cause it to compress? Which values for k cause the graph to reflect over the y-axis? What is the significance of k = −1?
- After students have a good understanding of the impact of f(x) + k, kf(x), f(kx) and f(x + k) on graphs of functions, connect that knowledge to tables of values for a function.
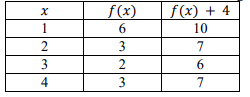
- For f(x) + k, use graphing technology to display a graph of a quadratic function (like the one below) and set k = 4. Guide students to form a table and discuss its connection to the vertical translation observed on the graph.
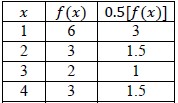
- For kf(x), use graphing technology to display a graph of a quadratic function (like the one below) and set k = 0.5. Guide students to form a table and discuss its connection to the vertical compression observed on the graph.
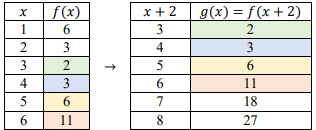
- For f(x + k), use graphing technology to display a graph of a quadratic function (like the one below) and set k = 2. Guide students to form a table and discuss its connection to the horizontal translation observed on the graph. This one may be tricky for students to understand initially. For the table shown, consider x = 5. For f(x), f(5) = 6. But for g(x) = f(x + 2), g(5) = f(5 + 2) which is equivalent to 18, which is equivalent to shifting f(7) two units to the left on the graph. Bridge this conversation with a graph of the two functions to help them understand the connection.
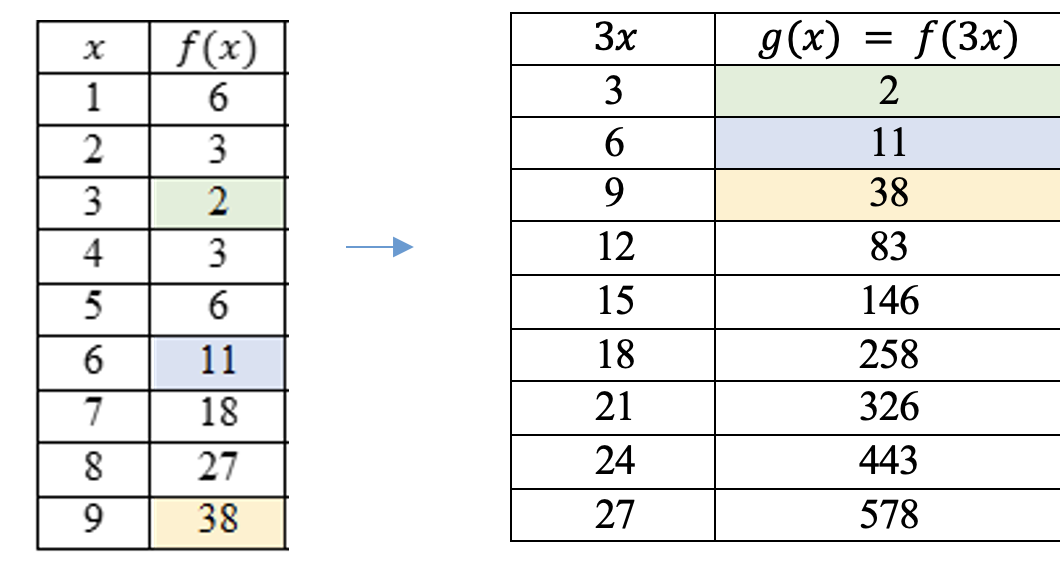
- For f(kx), use graphing technology to display a graph of a quadratic function (like the one below) and set k = 3. Guide students to form a table and discuss its connection to the horizontal compression observed on the graph using the highlighted values.
Common Misconceptions or Errors
- Similar to writing functions in vertex form, students may confuse effect of the sign of k in f(x + k). Direct these students to examine a graph of the two functions to see that the horizontal shift is opposite of the sign of k.
- Vertical stretch/compression can be hard for students to see on linear functions initially and they may interpret stretch/compression as rotation. Introduce the effects of kf(x) and f(kx) by using a quadratic or absolute value function first before analyzing the effect on a linear function.
- Students may think that a vertical and horizontal stretch from kf(x) and f(kx) look the same. For linear and quadratic functions, it can help to have a non-zero y-intercept to visualize the difference.
Strategies to Support Tiered Instruction
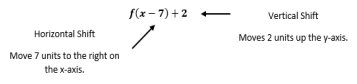
- Instruction includes explaining to students that horizontal shifts are “inside” of the function. Additionally, the teacher provides instruction to ensure understanding that the movement of the function is opposite of the sign that effects the horizontal shift.
- For example, teacher can provide the identification of the type of transformation and its effects to the below function.
- Teacher provides instruction that includes the use of a graph that displays stretch and compression scaling. Including a visual representation will allow students to categorize their thinking.
- For example, have students copy the graphs into their interactive notebooks. Give students an opportunity to identify changes in both types of transformations before giving students the transformations.
- Teachers can also introduce the effects of kf(x) and f(kx) by using a quadratic or absolute value function first before analyzing the effect on a linear function.
- Instruction includes providing a grid with a parent function and horizontal and vertical stretch on one grid, using different colors to distinguish both types of stretches (vertical and horizontal).
- Instruction includes directing students to examine a graph of the two functions to see that the horizontal shift is opposite of the sign of k.
- Instruction includes having a non-zero y-intercept to visualize the difference between scaling in the horizontal direction, f(kx), and scaling in the vertical direction, kf(x).
Instructional Tasks
Instructional Task 1 (MTR.3.1)
- Part A. Given the function f(x) = x2, determine the vertex, domain and range.
- Part B. If the function f(x) is translated to the right 6 units, predict what may happen to the vertex, domain and range.
- Part C. How does the graph of the function f(x) = x2 − 7, compare to the graph of the function in Part A?
Instructional Items
Instructional Item 1
- How does the graph of g(x) = f(x) − 2 compare to the graph of f(x) = |x + 3|?
Instructional Item 2
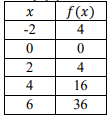
- Describe the effect of the transformation f(x) + 2 on the function table below.
Instructional Item 3
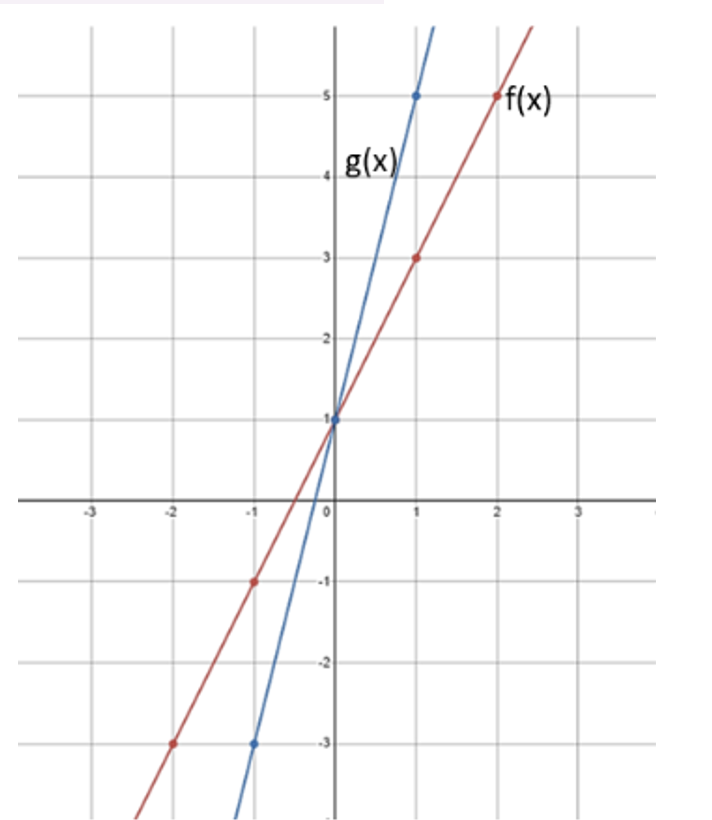
- The graph of two functions is shown below.
Which of the following describes the effect on f(x) after a transformation was performed to produce g(x)?
a. The graph of g(x) is reflected over the x-axis of the graph f(x)
b. The graph of g(x) is a vertical shift of 2 from the graph f(x)
c. The graph g(x) of is a horizontal shift of 1/2 from the graph of f(x)
d. The graph of g(x) is a horizontal stretch by a factor of 2 from the graph of f(x)
*The strategies, tasks and items included in the B1G-M are examples and should not be considered comprehensive.