General Information
Related Benchmark: MAFS.7.SP.2.3
Reporting Category: Statistics & Probability
Type: GRID: Graphic Response Item Display
Difficulty: N/A
Question:
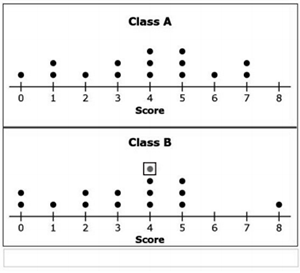
Two classes have a trivia contest. Each student is asked eight questions and is scored on the number of correct answers. The teachers create a dot plot of the scores from 15 students from Class A and 14 students from Class B, as shown.
Another score is added to the plot for Class B to make the median of the two data sets equal.
Click on the dot plot to show where this score could have been added.
Possible Answer: