Sample Test Item Preview


This document was generated on CPALMS - www.cpalms.org


General Information

Related Standards: MAFS.7.SP.2.3
Reporting Category: Statistics & Probability
Type: GRID: Graphic Response Item Display
Difficulty: N/A
Question:

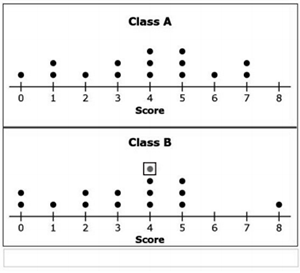
Two classes have a trivia contest. Each student is asked eight questions and is scored on the number of correct answers. The teachers create a dot plot of the scores from 15 students from Class A and 14 students from Class B, as shown.

Another score is added to the plot for Class B to make the median of the two data sets equal.

Click on the dot plot to show where this score could have been added.

Possible Answer:
Aligned Standards

Code Description
MAFS.7.SP.2.3: Informally assess the degree of visual overlap of two numerical data distributions with similar variabilities, measuring the difference between the centers by expressing it as a multiple of a measure of variability. For example, the mean height of players on the basketball team is 10 cm greater than the mean height of players on the soccer team, about twice the variability (mean absolute deviation) on either team; on a dot plot, the separation between the two distributions of heights is noticeable.


Printed On:4/30/2024 11:16:37 PM
Print Page | Close this window