


General Information
Related Benchmark: MAFS.8.SP.1.2
Reporting Category: Statistics & Probability
Type: MC: Multiple Choice
Difficulty: N/A
Question:
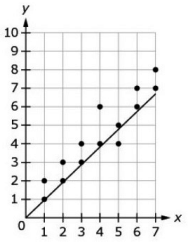
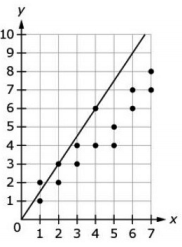
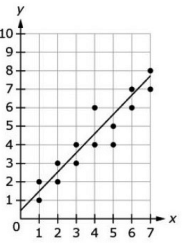
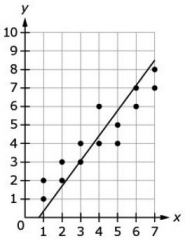
Which graph represents the line of best fit for the scatter plot?
Answer Options:
A.
B.
C.
D.
Answer Key:
C

