Sample Test Item Preview


This document was generated on CPALMS - www.cpalms.org


General Information

Related Standards: MAFS.8.SP.1.2
Reporting Category: Statistics & Probability
Type: MC: Multiple Choice
Difficulty: N/A
Question:

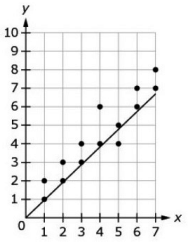
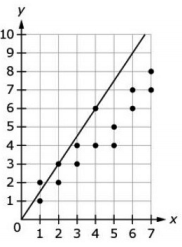
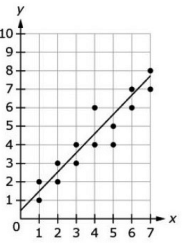
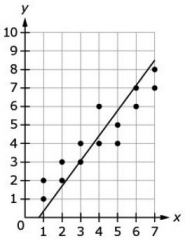
Which graph represents the line of best fit for the scatter plot?


Answer Options:

 A.
B.
C.
D.
Answer Key:
C

Aligned Standards

Code Description
MAFS.8.SP.1.2: Know that straight lines are widely used to model relationships between two quantitative variables. For scatter plots that suggest a linear association, informally fit a straight line, and informally assess the model fit by judging the closeness of the data points to the line.


Printed On:4/29/2024 1:08:23 PM
Print Page | Close this window