


Determine and describe how changes in data values impact measures of central tendency.
Remarks
Example: Mrs. Donohue has told her students that she will remove the lowest exam score for each student at the end of the grading period. Sara received grades of 43, 78, 84, 85, 88, 78, and 90 on her exams. What will be the different between the mean, median, and mode of her original grades and the mean, median, and mode of her five grades after Mrs. Donohue removes one grade?
General Information
Subject Area: X-Mathematics (former standards - 2008)
Grade: 8
Body of Knowledge: Statistics
Idea: Level 2: Basic Application of Skills & Concepts
Big Idea: BIG IDEA 3 - Analyze and summarize data sets.
Date Adopted or Revised: 09/07
Content Complexity Rating:
Level 2: Basic Application of Skills & Concepts
-
More Information
Date of Last Rating: 06/07
Status: State Board Approved - Archived
Assessed: Yes
Test Item Specifications
-
Item Type(s):
This benchmark may be assessed using:
MC
,
GR
item(s)
At Grade 8, this benchmark will be assessed using MC and GR items.
- Clarification :
Students will determine how changes in data impact the mean, median, or mode (e.g., students will identify one missing data point in a set given the mean and median of the data set and all other data points).
Students will determine the missing numbers in a data set when given the values of the measures of central tendency.
Students will analyze how the measures of central tendency and variability of a data set are affected by including additional data points or excluding data points in a set, especially outliers. - Content Limits :
Data sets used in items shall be limited to a maximum of 12 data points, and no more than three categories of information should be used.
Items will assess finding the mean, median, or mode of a set of data presented in a chart, table, graph, or plot (e.g., scatter plot, stem-andleaf plot, line plot, or box-and-whisker plot) when there is a change in the data set given. - Stimulus Attributes :
Items should be set in a real-world context.
Data contained in these items need not be ordered.
Graphics should be used in most of these items, as appropriate.
Sample Test Items (2)
- Test Item #: Sample Item 1
- Question: Annie runs 5 days per week to train for a race. Her running distances for four days this week are shown in the table below.
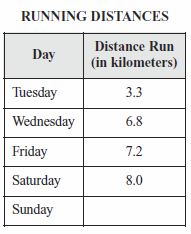
What is the number of kilometers Annie must run on Sunday to have a mean running distance of exactly 6.1 kilometers per day for the 5 days?
- Difficulty: N/A
- Type: MC: Multiple Choice
- Test Item #: Sample Item 2
- Question: Every week, 3 members of a cooking club total their food costs and then determine the mean amount each person should contribute. This week, the mean contribution per member is $30. A fourth person who wants to join the cooking club buys $20 worth of food. What is the mean contribution for this week if the fourth person joins the cooking club?
- Difficulty: N/A
- Type: GR: Gridded-Response
Related Access Points
Alternate version of this benchmark for students with significant cognitive disabilities.
Related Resources
Vetted resources educators can use to teach the concepts and skills in this benchmark.
Virtual Manipulative
Student Resources
Vetted resources students can use to learn the concepts and skills in this benchmark.
Virtual Manipulative
Box Plotter:
Users select a data set or enter their own data to generate a box plot.
Type: Virtual Manipulative
Parent Resources
Vetted resources caregivers can use to help students learn the concepts and skills in this benchmark.


