


Create and interpret tables, graphs, and models to represent, analyze, and solve problems related to linear equations, including analysis of domain, range, and the difference between discrete and continuous data.
Remarks
Example 1: Jan decided to save some money. She already had $25. She received and saved $5 on Friday each week for 8 weeks. Make a table and a graph of the money she would have each week. If she continues with this same savings plan, how much money will she have after 2 years? Is the situation in this problem continuous or discrete?The problem above is technically a discrete problem. A continuous linear function such as y=25+ 5x may be used to fit the data and to solve the problem. If the domain is integers, this is a discrete function. If the domain is all real numbers, this is a continuous function.
General Information
Subject Area: X-Mathematics (former standards - 2008)
Grade: 8
Body of Knowledge: Algebra
Idea: Level 3: Strategic Thinking & Complex Reasoning
Big Idea: BIG IDEA 1 - Analyze and represent linear functions, and solve linear equations and systems of linear equations.
Date Adopted or Revised: 09/07
Content Complexity Rating:
Level 3: Strategic Thinking & Complex Reasoning
-
More Information
Date of Last Rating: 06/07
Status: State Board Approved - Archived
Assessed: Yes
Test Item Specifications
-
Item Type(s):
This benchmark may be assessed using:
MC
item(s)
- Clarification :
Students will find solutions for linear problems by creating or interpreting tables, graphs, or models.
Problems should be solved using concrete or pictorial representations of models, tables, and graphs, rather than solved abstractly using algebraic symbolism.
Students will determine whether the content in the problem uses discrete or continuous data and/or will determine the relevant domain and range. - Content Limits :
Equations used in items should include no more than two variables and no more than two operations.
Values in expressions should be rational numbers.
In items that contain equations, the equation must be linear. - Stimulus Attributes :
Items should be set in a real-world context.
Sample Test Items (1)
- Test Item #: Sample Item 1
- Question: Sandy conducted an experiment with sound waves in dry air at 20ºC. She observed that a linear relationship exists between the time and distance that sound travels under these conditions. She recorded her findings in the table below.
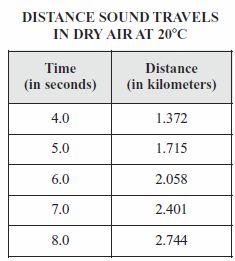
Based on the information in the table, which of the following is a valid statement about Sandy’s recorded findings?
- Difficulty: N/A
- Type: MC: Multiple Choice
Related Access Points
Alternate version of this benchmark for students with significant cognitive disabilities.
Related Resources
Vetted resources educators can use to teach the concepts and skills in this benchmark.
Educational Software / Tool
Lesson Plan
Problem-Solving Task
Virtual Manipulative
Student Resources
Vetted resources students can use to learn the concepts and skills in this benchmark.
Virtual Manipulative
Multi Bar Graph:
This activity allows the user to graph data sets in multiple bar graphs. The color, thickness, and scale of the graph are adjustable which may produce graphs that are misleading. Users may input their own data, or use or alter pre-made data sets. This activity includes supplemental materials, including background information about the topics covered, a description of how to use the application, and exploration questions for use with the java applet.
Type: Virtual Manipulative
Parent Resources
Vetted resources caregivers can use to help students learn the concepts and skills in this benchmark.


