


Clusters should not be sorted from Major to Supporting and then taught in that order. To do so would strip the coherence of the mathematical ideas and miss the opportunity to enhance the major work of the grade with the supporting clusters.
- Assessment Limits :
Numbers in items must be rational numbers. Data given should include the grand total of the survey. Tables must not include more than two columns (plus category and total) and two rows (plus category and total). - Calculator :
Yes
- Context :
Required
- Test Item #: Sample Item 1
- Question: Two hundred sixty students were surveyed on whether they prefer apple juice or
orange juice. A table of relative frequencies is shown.
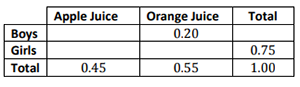
How many more girls prefer apple juice than boys?
- Difficulty: N/A
- Type: EE: Equation Editor
- Test Item #: Sample Item 2
- Question:
Five hundred students were asked whether they prefer apple juice or orange juice. The table shown displays the results.
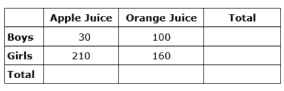
How many more girls were surveyed than boys?
- Difficulty: N/A
- Type: EE: Equation Editor
- Test Item #: Sample Item 3
- Question:
The manager of an ice cream shop is considering which ice cream flavor to offer as the special flavor next month. She asks 175 people whether they like mint or strawberry ice cream.
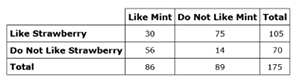
The manager wants to increase sales, so she is deciding whether to offer mint or strawberry ice cream.
Complete the sentence to support the best decision based on the relative frequencies in the table.
The manager should offer _____ ice cream because _____ of the customers surveyed like mint and _____ of the customers like strawberry.
- Difficulty: N/A
- Type: ETC: Editing Task Choice
Related Courses
Related Access Points
Related Resources
Formative Assessments
Lesson Plans
Problem-Solving Tasks
Student Center Activity
Virtual Manipulatives
MFAS Formative Assessments
Students are asked to construct a two-way frequency table given a set of raw data.
Students are asked to describe an association between two variables given a table of relative frequencies by column.
Students are asked to describe an association between two variables given a table of relative frequencies by row.
Students are asked to convert raw data to relative frequencies by both rows and columns given a two-way frequency table.
Student Resources
Problem-Solving Tasks
This task asks the student to gather data on whether classmates play an instrument and/or participate in a sport, summarize the data in a table and decide whether there is an association between playing a sport and playing an instrument. Finally, the student is asked to create a graph to display any association between the variables.
Type: Problem-Solving Task
Students are asked to examine data given in table format and then calculate either row percentages or column percentages and state a conclusion about the meaning of the data. Either calculation is appropriate for the solution since there is no clear relationship between the variables. Whether the student sees a strong association or not is less important than whether his or her answer uses the data appropriately and demonstrates understanding that an association means the distribution of favorite subject is different for 7th graders and 8th graders.
Type: Problem-Solving Task
Student Center Activity
Students can practice answering mathematics questions on a variety of topics. With an account, students can save their work and send it to their teacher when complete.
Type: Student Center Activity
Virtual Manipulative
This manipulative allows the user to enter multiple coordinates on a grid, estimate a line of best fit, and then determine the equation for a line of best fit.
Type: Virtual Manipulative
Parent Resources
Problem-Solving Tasks
This task asks the student to gather data on whether classmates play an instrument and/or participate in a sport, summarize the data in a table and decide whether there is an association between playing a sport and playing an instrument. Finally, the student is asked to create a graph to display any association between the variables.
Type: Problem-Solving Task
Students are asked to examine data given in table format and then calculate either row percentages or column percentages and state a conclusion about the meaning of the data. Either calculation is appropriate for the solution since there is no clear relationship between the variables. Whether the student sees a strong association or not is less important than whether his or her answer uses the data appropriately and demonstrates understanding that an association means the distribution of favorite subject is different for 7th graders and 8th graders.
Type: Problem-Solving Task


