


- Decide whether two quantities are in a proportional relationship, e.g., by testing for equivalent ratios in a table or graphing on a coordinate plane and observing whether the graph is a straight line through the origin.
- Identify the constant of proportionality (unit rate) in tables, graphs, equations, diagrams, and verbal descriptions of proportional relationships.
- Represent proportional relationships by equations. For example, if total cost t is proportional to the number n of items purchased at a constant price p, the relationship between the total cost and the number of items can be expressed as t = pn.
- Explain what a point (x, y) on the graph of a proportional relationship means in terms of the situation, with special attention to the points (0, 0) and (1, r) where r is the unit rate.
Remarks
Examples of Opportunities for In-Depth FocusStudents in grade 7 grow in their ability to recognize, represent, and analyze proportional relationships in various ways, including by using tables, graphs, and equations.
Clusters should not be sorted from Major to Supporting and then taught in that order. To do so would strip the coherence of the mathematical ideas and miss the opportunity to enhance the major work of the grade with the supporting clusters.
- Assessment Limits :
Ratios should be expressed as fractions, with “:” or with words. Units may be the same or different across the two quantities. - Calculator :
Neutral
- Context :
Allowable
- Test Item #: Sample Item 1
- Question: Ethan ran 11 miles in 2 hours. What is the unit rate of miles to hour?
- Difficulty: N/A
- Type: MC: Multiple Choice
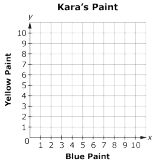
- Test Item #: Sample Item 2
- Question: Kara is mixing paint. Each batch has twice as much blue paint as yellow paint.
Plot points to represent the amount of blue and yellow paint used in three different-sized batches.
- Difficulty: N/A
- Type: GRID: Graphic Response Item Display
- Test Item #: Sample Item 3
- Question: The points on the coordinate plane show the amount of red and yellow paint in each
batch.
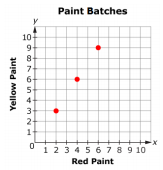
Write an equation to represent the relationship between red paint, r, and yellow paint, y, in each batch.
- Difficulty: N/A
- Type: EE: Equation Editor
- Test Item #: Sample Item 4
- Question:
The graph below represents the rate for the cost of b books.
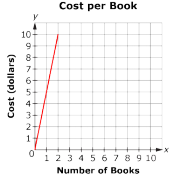
Write an equation to represent the cost, c.
- Difficulty: N/A
- Type: EE: Equation Editor
- Test Item #: Sample Item 5
- Question: The ordered pair (1, 5) indicates the unit rate of books to cost on the graph shown.
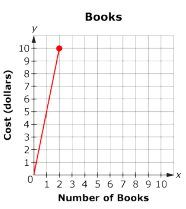
What does the point on the graph represent?
- Difficulty: N/A
- Type: OR: Open Response
Related Courses
Related Access Points
Related Resources
Educational Software / Tool
Formative Assessments
Lesson Plans
Perspectives Video: Professional/Enthusiasts
Problem-Solving Tasks
Tutorials
Unit/Lesson Sequences
Virtual Manipulatives
MFAS Formative Assessments
Students are given a graph that models the hourly earnings of a babysitter and are asked to interpret ordered pairs in context.
Students are asked to identify and explain the constant of proportionality given a verbal description and a diagram representing a proportional relationship.
Students decide if two variables are proportionally related based on data given in a table.
Students are asked to determine the constant of proportionality using a table and a graph.
Students are asked to identify the graph of a proportional relationship.
Students are asked to identify and explain the constant of proportionality in three different equations.
Students are given the number of calories in a serving of oatmeal and are asked to write an equation that models the relationship between the size of the serving and the number of calories.
Students are asked to graph four ordered pairs given in context and decide if the variables they represent are proportionally related.
Students are asked to write an equation to represent a proportional relationship depicted in a graph.
Student Resources
Perspectives Video: Professional/Enthusiast
An archaeologist describes how mathematics can help prove a theory about mysterious prehistoric structures called shell rings.
Type: Perspectives Video: Professional/Enthusiast
Problem-Solving Tasks
Students are asked to use ratios and proportional reasoning to compare paint mixtures numerically and graphically.
Type: Problem-Solving Task
This problem requires a comparison of rates where one is given in terms of unit rates, and the other is not. See "Music Companies, Variation 2" for a task with a very similar setup but is much more involved and so illustrates .
Type: Problem-Solving Task
Students should use information provided to answer the questions regarding robot races.
Type: Problem-Solving Task
Students are asked to decide if two given ratios are equivalent.
Type: Problem-Solving Task
Tutorials
This video shows how to recognize and understand graphs of proportional relationships to find the constant of proportionality.
Type: Tutorial
Here's an introductory video explaining the basic reasoning behind solving proportions and shows three different methods for solving proportions which you will use later on to solve more difficult problems.
Type: Tutorial
This video provides assistance with understanding direct and inverse variation.
Type: Tutorial
This site explicitly outlines the steps for using the proportion method to solve three different kinds of percent problems. It also includes sample problems for practice determining the part, the whole or the percent.
Type: Tutorial
Virtual Manipulatives
Allows students access to a Cartesian Coordinate System where linear equations can be graphed and details of the line and the slope can be observed.
Type: Virtual Manipulative
With a mouse, students will drag data points (with their error bars) and watch the best-fit polynomial curve form instantly. Students can choose the type of fit: linear, quadratic, cubic, or quartic. Best fit or adjustable fit can be displayed.
Type: Virtual Manipulative
Parent Resources
Perspectives Video: Professional/Enthusiast
An archaeologist describes how mathematics can help prove a theory about mysterious prehistoric structures called shell rings.
Type: Perspectives Video: Professional/Enthusiast
Problem-Solving Tasks
Students are asked to use ratios and proportional reasoning to compare paint mixtures numerically and graphically.
Type: Problem-Solving Task
Giving the amount of paint in "parts" instead of a specific standardized unit like cups might be confusing to students who do not understand what this means. Because this is standard language in ratio problems, students need to be exposed to it, but teachers might need to explain the meaning if their students are encountering it for the first time.
Type: Problem-Solving Task
This is a task where it would be appropriate for students to use technology such as a graphing calculator or GeoGebra, making it a good candidate for students to engage in Standard for Mathematical Practice 5 Use appropriate tools strategically. A variant of this problem is appropriate for 8th grade; see Coffee by the Pound.
Type: Problem-Solving Task
This problem requires a comparison of rates where one is given in terms of unit rates, and the other is not. See "Music Companies, Variation 2" for a task with a very similar setup but is much more involved and so illustrates .
Type: Problem-Solving Task
Students should use information provided to answer the questions regarding robot races.
Type: Problem-Solving Task
Students are asked to decide if two given ratios are equivalent.
Type: Problem-Solving Task
Virtual Manipulative
Allows students access to a Cartesian Coordinate System where linear equations can be graphed and details of the line and the slope can be observed.
Type: Virtual Manipulative


