General Information
                                            Related Benchmark: MAFS.6.SP.2.5
                                                Reporting Category: Statistics & Probability
                                                Type: MS: Multiselect
                                                Difficulty: N/A
                                                    
                                                        Question: 
                                                        
                                                    A dot plot shows the number of cans students at Epping Middle School collected for
a canned food drive.
                                                    

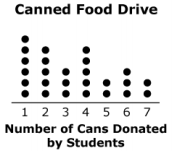
Select all the options that describe the best measure of center to represent the data in the dot plot.
                                                        Answer Options: 
                                                        
                                                    
                                            A. mode
B. mean
C. range
D. median
E. interquartile range