![Cpalms [Logo]](/images/cpalms_color.png)

Please sign in to access this resource
Click here to sign in
as a FL public educator Student
Access the resource on
FloridaStudents.org
Not a Florida public school educator?
Access this resourceon CPALMS.com


General Information
Aligned Standards
This vetted resource aligns to concepts or skills in these benchmarks.Related Videos

COAPS oceanographer Dmitry Dukhovskoy describes the process used to mathematically model eddy shedding in the Gulf of Mexico.

Laws and regulations that affect the public are being formed based on data from a variety of laboratories. How can we be sure that the laboratories are all standardized?

Statistical analysis played an essential role in using microgravity sensors to determine location of caves in Wakulla County.
Download the CPALMS Perspectives video student note taking guide.

The tide is high! How can we statistically prove there is a relationship between the tides on the Gulf Coast and in a fresh water spring 20 miles from each other?
Download the CPALMS Perspectives video student note taking guide.
Chip Cotton, fishery biologist, discusses his use of mathematical regression modeling and how well the data fits his models based on his deep sea shark research.
Download the CPALMS Perspectives video student note taking guide.
Shark researcher, Chip Cotton, discusses the use of regression lines, slope, and determining the strength of the models he uses in his research.
Download the CPALMS Perspectives video student note taking guide.
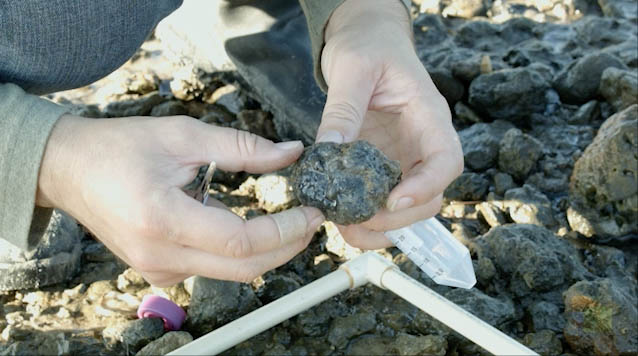
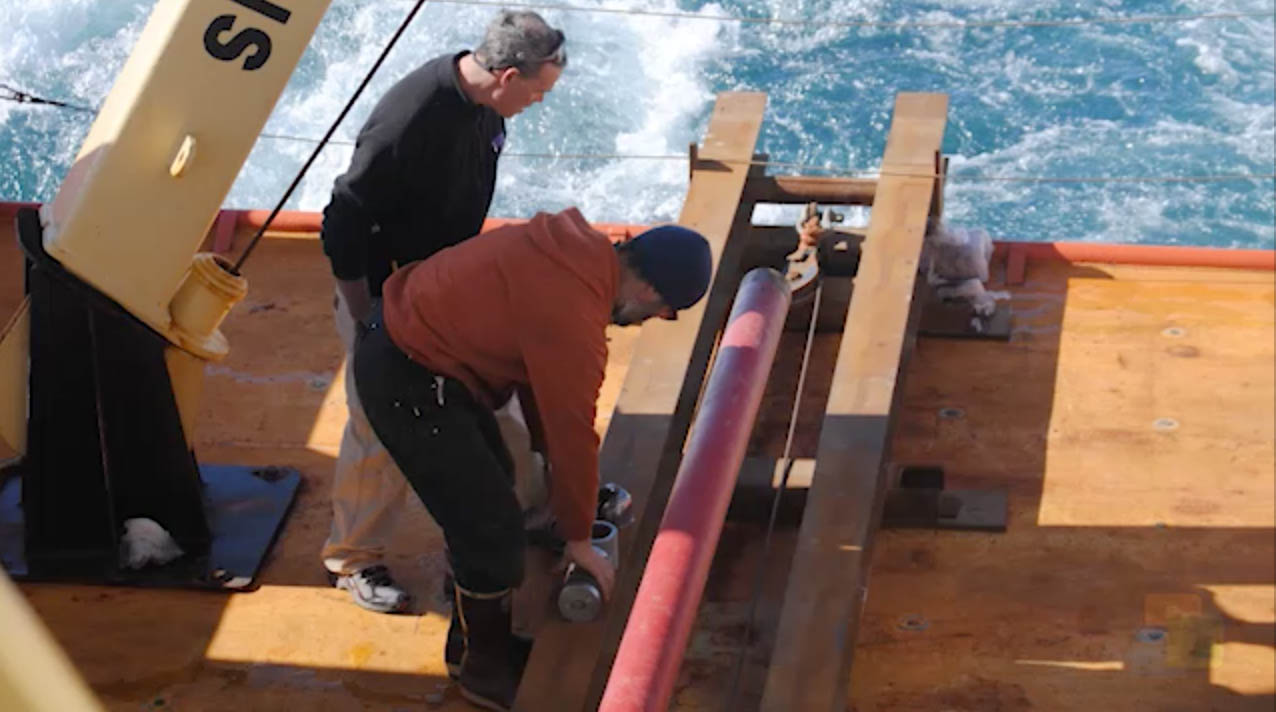
In this video, Brad Rosenheim describes how Louisiana sediment cores are used to estimate sea level changes over the last 10,000 years. Video funded by NSF grant #: OCE-1502753.
Wei Wu discusses his statistical contributions to the Birdsong project which help to quantify the differences in the changes of the zebra finch's song.

Brandon Reese, a PhD candidate in the FAMU-FSU College of Engineering, discusses the significance of both Bernoulli's equation and statistical analysis for the design of a "smart wing."

Hear this oceanography student float some ideas about how statistics are used in research.

What does it mean to be normally distributed? What do oceanographers do when the collected data is not normally distributed?

A discussion describing ocean currents studied by a physical oceanographer and how math is involved.

Data logging has transformed competitive racing! These SCCA drivers discuss how they use computers to compare multiple sets of data after test runs.

Ecologist Rebecca Means discusses the use of statistical sampling and comparative studies in field biology.

This quantitative measurement and statistics activity will allow you to save face.

Florida State University Counseling Psychologist discusses how he uses confidence intervals to make inferences on college students' experiences on campus based on a sample of students.
Will Ryan describes methods for collecting multiple random samples of anemones in coastal marine environments.
Will Ryan describes how linear regression models contribute towards his research on sea anemones.
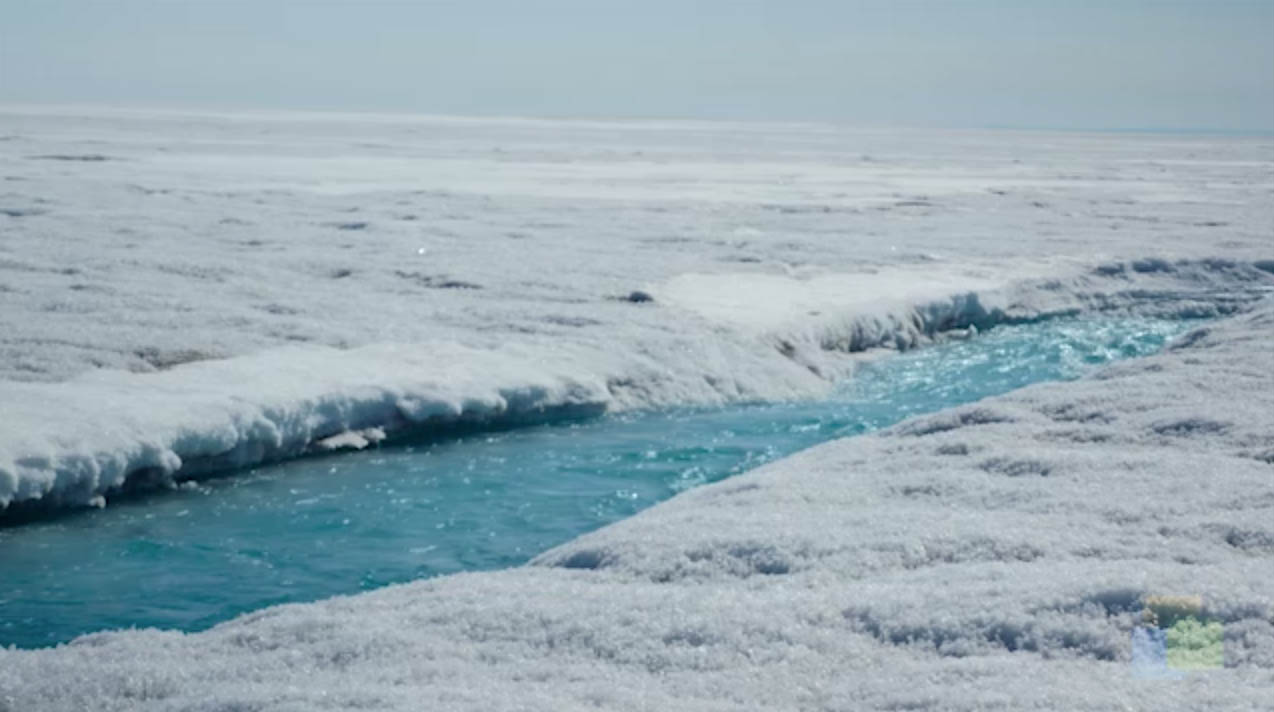
In this video, Eugene Domack explains how past Antarctic ice sheet movement rates allow us to understand sea level changes. Video funded by NSF grant #: OCE-1502753.
Download the CPALMS Perspectives video student note taking guide.
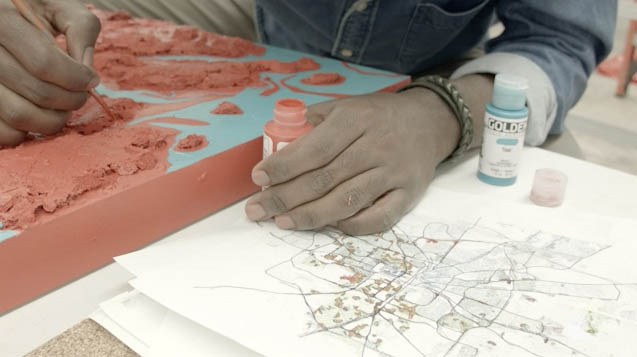
Graphic designer and artist, Drexston Redway infuses statistics into his artwork to show population distribution and overlap of poverty and ethnicity in Tallahassee, FL.
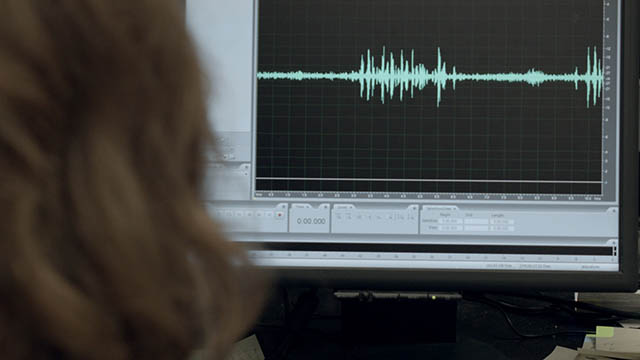
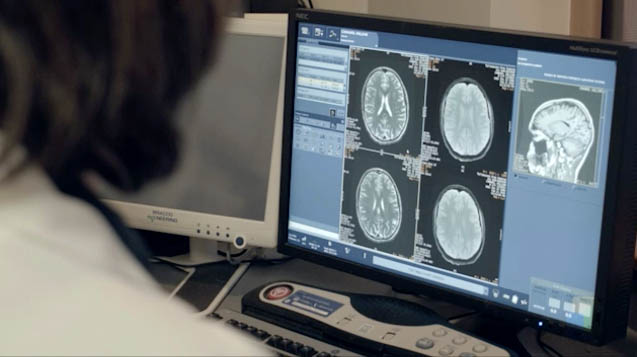
Researchers Frank Johnson, Richard Bertram, Wei Wu, and Rick Hyson explore the necessity of scientific and mathematical collaboration in modern neuroscience, as it relates to their NSF research on birdsong.

Hydrogeologist from Nestle Waters discusses the importance of statistical tests in monitoring sustainability and in maintaining consistent water quality in bottled water.
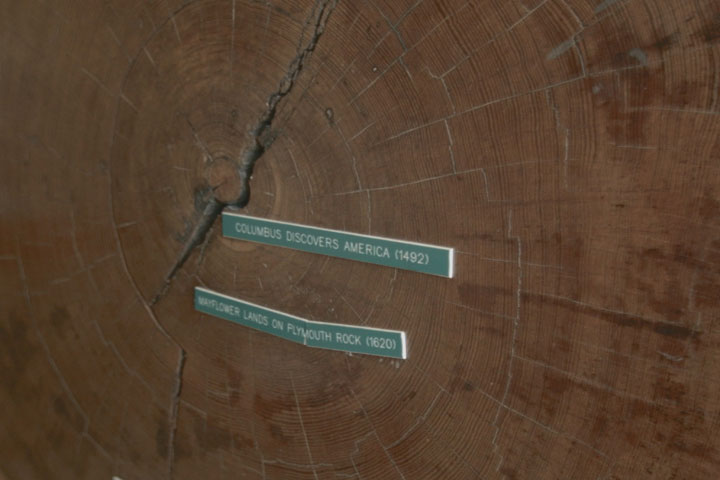
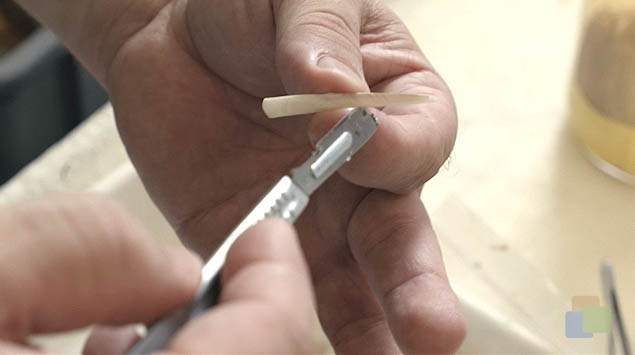
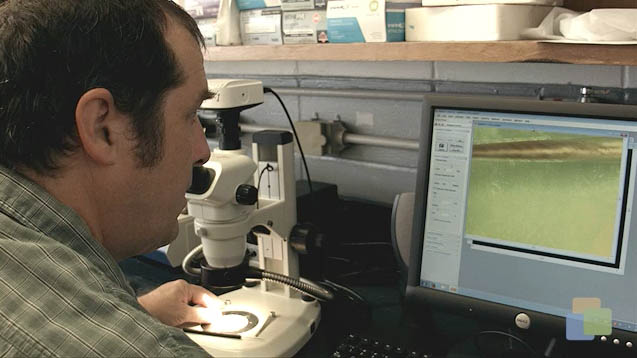
In this video, fire ecologist Monica Rother describes tree ring research and applications for land management.


