


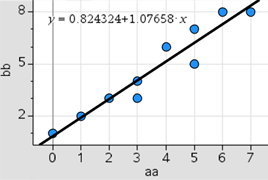
Draw the line of best fit on a scatter plot.
Clarifications:
Essential Understandings
Concrete:
- Draw a line between two points on a graph.
- Identify when data points are close together or spread out.
- Use appropriate manipulatives (uncooked spaghetti noodle, clear ruler, popsicle stick, etc.) to approximate the line of best fit.
- Understand the following concepts and vocabulary: best fit line, variable, outliers, box plot, scatter plots, data points.
- Given three choices, select the line of best fit.
General Information
Number: MAFS.8.SP.1.AP.2a
Category: Access Points
Date Adopted or Revised:
06/14
Cluster:
Investigate patterns of association in bivariate data. (Supporting Cluster) :
Clusters should not be sorted from Major to Supporting and then taught in that order. To do so would strip the coherence of the mathematical ideas and miss the opportunity to enhance the major work of the grade with the supporting clusters.
Related Standards
This access point is an alternate version of the following benchmark(s).
Related Courses
This access point is part of these courses.
1205050: M/J Accelerated Mathematics Grade 7
1205070: M/J Grade 8 Pre-Algebra
1204000: M/J Foundational Skills in Mathematics 6-8
7812030: Access M/J Grade 8 Pre-Algebra
2003030: M/J STEM Physical Science
2002200: M/J STEM Environmental Science
2001025: M/J STEM Astronomy and Space Science
2000025: M/J STEM Life Science
Related Resources
Vetted resources educators can use to teach the concepts and skills in this access point.
Lesson Plan
Student Resources
Vetted resources students can use to learn the concepts and skills in this access point.
Parent Resources
Vetted resources caregivers can use to help students learn the concepts and skills in this access point.


