


Clusters should not be sorted from Major to Supporting and then taught in that order. To do so would strip the coherence of the mathematical ideas and miss the opportunity to enhance the major work of the grade with the supporting clusters.
- Assessment Limits :
Data sets in items must be numerical data sets. - Calculator :
No
- Context :
Allowable
- Test Item #: Sample Item 1
- Question: Tim drives the Grand Avenue bus route. The total number of people who ride the bus
each week for 5 weeks is shown in the data table.
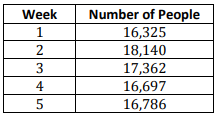
How many more people need to ride the bus in week 6 to increase the mean number of riders per week by 10?
- Difficulty: N/A
- Type: EE: Equation Editor
- Test Item #: Sample Item 2
- Question: Linda recorded the number of minutes she practiced playing her violin for
10 days. The table shown represents the data she collected.
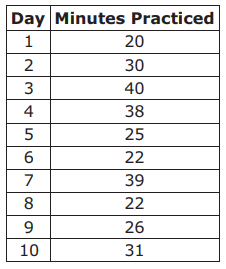
A. According to the data, what is the average amount of time Linda spent practicing per day?
B. What is Linda’s variation among all 10 days?
- Difficulty: N/A
- Type: EE: Equation Editor
- Test Item #: Sample Item 3
- Question: Tim drives the Grand Avenue bus route. He records the total number of
passengers each week for 4 weeks.
The mean and mean absolute deviation of the data are shown.
- Mean: 17,123
- Mean absolute deviation: 611
- Difficulty: N/A
- Type: MS: Multiselect
Related Courses
Related Access Points
Related Resources
Formative Assessments
Lesson Plans
Original Student Tutorials
Perspectives Video: Expert
Problem-Solving Task
Teaching Ideas
Tutorial
Virtual Manipulative
Worksheet
STEM Lessons - Model Eliciting Activity
After reading the market report for the real estate sales in Miami during the first quarter, students will decide which type of property they want to consider for investment that can be sold during the next year and still make a profit from the sale. In addition, students will determine the best location to make the investment. Luxury homes are selling faster this year, while there is not inventory for single families houses. The median prices for condos and apartments are lower, but the number of sales is going up. Students also consider price fluctuation between different locations.
Model Eliciting Activities, MEAs, are open-ended, interdisciplinary problem-solving activities that are meant to reveal students’ thinking about the concepts embedded in realistic situations. Click here to learn more about MEAs and how they can transform your classroom.
MFAS Formative Assessments
Students are asked to explain the difference between measures of center and measures of variability.
Students are asked to list measures of center and explain what they indicate about a set of data.
Students are asked to list measures of variability and explain what they indicate about a set of data.
Original Student Tutorials Mathematics - Grades 6-8
Learn how to calculate and interpret the Mean Absolute Deviation (MAD) of data sets in this travel-themed, interactive statistics tutorial.
Original Student Tutorials Mathematics - Grades 9-12
Discover how to calculate and interpret the mean, median, mode and range of data sets from the zoo in this interactive tutorial.
Student Resources
Original Student Tutorials
Learn how to calculate and interpret the Mean Absolute Deviation (MAD) of data sets in this travel-themed, interactive statistics tutorial.
Type: Original Student Tutorial
Discover how to calculate and interpret the mean, median, mode and range of data sets from the zoo in this interactive tutorial.
Type: Original Student Tutorial
Tutorial
The focus of this video is to help you understand the core concepts of arithmetic mean, median, and mode.
Type: Tutorial
Virtual Manipulative
Users select a data set or enter their own data to generate a box plot.
Type: Virtual Manipulative


