


General Information
Related Benchmark: MA.5.S.7.1
Reporting Category: Statistics
Type: MC: Multiple Choice
Difficulty: N/A
Question:
The graph below shows the number of boys and girls enrolled in three grades at Main Street Elementary School.
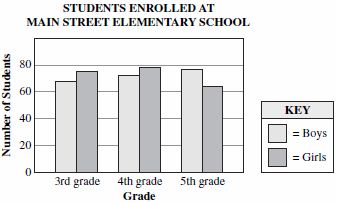
Based on the graph, which of the following statements is true about the enrollment at Main Street Elementary School?
Answer Options:
A. The total number of 4th grade students is approximately 70.
B. The total number of 5th grade students is approximately 140.
C. The number of 4th grade boys is less than the number of 3rd grade boys.
D. The number of 5th grade girls is greater than the number of 5th grade boys.
B. The total number of 5th grade students is approximately 140.
C. The number of 4th grade boys is less than the number of 3rd grade boys.
D. The number of 5th grade girls is greater than the number of 5th grade boys.
Answer Key:
B
Item Context:
Mathematics


