MA.4.DP.1.2

Examples
Given the data of the softball team’s hat size represented on a line plot, determine the most common size and the difference between the largest and the smallest sizes.
Clarifications
Clarification 1: Instruction includes interpreting data within a real-world context.
Clarification 2: Instruction includes recognizing that data sets can have one mode, no mode or more than one mode.
Clarification 3: Within this benchmark, data sets are limited to an odd number when calculating the median.
Clarification 4: Denominators are limited to 2, 3, 4, 5, 6, 8, 10, 12, 16 and 100.
Alternate version of this benchmark for students with significant cognitive disabilities.
Connecting Benchmarks/Horizontal Alignment
Terms from the K-12 Glossary
- Line Plot
- Median
- Mode
- Range
- Stem-and-Leaf Plot
Vertical Alignment
Previous Benchmarks
Next Benchmarks
Purpose and Instructional Strategies
The purpose of this benchmark is to introduce concepts of mode, median, and range as measures of center and spread in a set of data. This work builds on interpreting different kinds of graphs with numerical and categorical data in grade 3 (MA.3.DP.1.2). The mean as a measure of center is introduced in grade 5 (MA.5.DP.1.2).- Instruction includes providing students multiple opportunities to organize their data (MA.4.FR.1.4). During instruction it is important for students to organize their data from least to greatest which will help them determine:
- range by subtracting the least value from the greatest value in the set.
- mode by finding the value that occurs most often.
- median by finding the value in middle of the set.
- For example, fifteen students were asked to rate how much they like fourth grade on a scale from one to ten. Here is the data collected: 1, 10, 9, 6, 5, 10, 9, 8, 3, 3, 8, 9, 7, 4, 5. The first step is to put the data in ascending order.
- 1, 3, 3, 4, 5, 5, 6, 7, 8, 8, 9, 9, 9, 10, 10. The median is 7, the mode is 9 and the range is 9.
Common Misconceptions or Errors
- Students sometimes have difficulty understanding that there may be no mode or more than one mode of a data set. Examples should be given to explicitly teach this concept.
- Students may confuse the range with the number of data points.
Strategies to Support Tiered Instruction
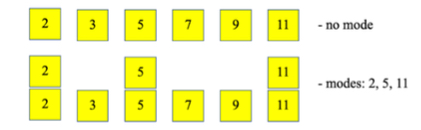
- Instruction includes providing a data set that may have no mode or more than one mode.
- For example, for the data set 2, 3, 5, 7, 9, 11, there is no mode.
- For example, for the data set 2, 2, 3, 5, 5, 7, 9, 11, 11, the modes are 2, 5, and 11.
- Instruction includes providing the data set on index cards or sticky notes. Students then move the data set in order from least to greatest. For numbers that repeat, students stack the numbers on top of each other. This helps with understanding if there is no mode, or more than one mode.
- Example:
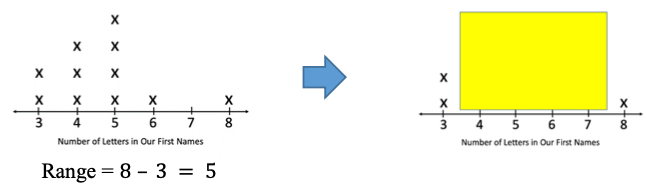
- Instruction includes opportunities to find the range on a line plot. Students subtract the least value on the line plot with an X from the greatest value with an X.
- Example:
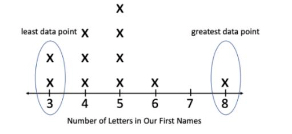
- Instruction includes showing how to cover up the data points in the middle of the line plot so that only the first and last data points are shown. This allows students to focus on the values that will be used to calculate the range.
- Example:
Instructional Tasks
Instructional Task 1 (MTR.7.1)
Measure the length of 10 used pencils in the class to the nearest inch.- Part A. Create a stem-and-leaf plot and a line plot to represent the length of all ten pencils.
- Part B. From your completed line plot, find the median, range and mode of your data set.
Instructional Items
Instructional Item 1
The line plot below shows all of the results of the sum of two six-sided dice.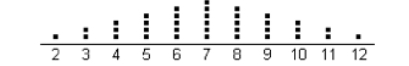
- a. 12
- b. 10
- c. 7
- d. 6
*The strategies, tasks and items included in the B1G-M are examples and should not be considered comprehensive.
General Information
Subject Area: Mathematics (B.E.S.T.)
Grade: 4
Strand: Data Analysis and Probability
Standard: Collect, represent and interpret data and find the mode, median and range of a data set.
Date Adopted or Revised: 08/20
Status: State Board Approved
This benchmark is part of these courses.