


General Information
Related Benchmark: MAFS.912.F-IF.2.6
Reporting Category: Functions: Interpreting Functions
Type: MC: Multiple Choice
Difficulty: N/A
Question:
The graph shows the number of acres, in millions, of farmland in the United States from 1975 to 2008.
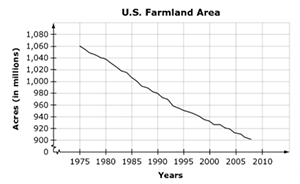
Which statement describes the average rate of change of the graph?
Answer Options:
A. The number of acres of farmland in the United States decreases by 0.21 million each year.
B. The amount of farmland in the United States decreases by 4.8 million acres each year.
C. The time it takes the farmland in the United States to decrease by 160 acres is 33 years.
D. Every 5 years, the amount of farmland in the United States decreases by 20 acres.
Answer Key:
B

