MAFS.912.S-ID.2.6Archived Standard

Represent data on two quantitative variables on a scatter plot, and describe how the variables are related.
  1. Fit a function to the data; use functions fitted to data to solve problems in the context of the data. Use given functions or choose a function suggested by the context. Emphasize linear, and exponential models.
  2. Informally assess the fit of a function by plotting and analyzing residuals.
  3. Fit a linear function for a scatter plot that suggests a linear association.

Remarks

Students take a more sophisticated look at using a linear function to model the relationship between two numerical variables. In addition to fitting a line to data, students assess how well the model fits by analyzing residuals.

General Information
Subject Area: Mathematics
Grade: 912
Domain-Subdomain: Statistics & Probability: Interpreting Categorical & Quantitative Data
Cluster: Level 2: Basic Application of Skills & Concepts
Cluster: Summarize, represent, and interpret data on two categorical and quantitative variables. (Algebra 1 - Supporting Cluster) (Algebra 2 - Supporting Cluster) -

Clusters should not be sorted from Major to Supporting and then taught in that order. To do so would strip the coherence of the mathematical ideas and miss the opportunity to enhance the major work of the grade with the supporting clusters.

Date Adopted or Revised: 02/14
Date of Last Rating: 02/14
Status: State Board Approved - Archived
Assessed: Yes
Test Item Specifications
    Also assesses:
    MAFS.912.S-ID.3.8

    MAFS.912.S-ID.3.9

  • Assessment Limits :
    In items that require the student to interpret or use the correlation
    coefficient, the value of the correlation coefficient must be given in
    the stem.
  • Calculator :

    Neutral

  • Clarification :
    Students will represent data on a scatter plot.

    Students will identify a linear function, a quadratic function, or an
    exponential function that was found using regression.

    Students will use a regression equation to solve problems in the
    context of the data.

    Students will calculate residuals.

    Students will create a residual plot and determine whether a function
    is an appropriate fit for the data.

    Students will determine the fit of a function by analyzing the
    correlation coefficient.

    Students will distinguish between situations where correlation does
    not imply causation.

    Students will distinguish variables that are correlated because one is
    the cause of another. 

  • Stimulus Attributes :
    Items should use real-world data and be set in a real-world context.
  • Response Attributes :
    Items may require the student to apply the basic modeling cycle.

    Items may require the student to choose an appropriate level of
    accuracy.

    Items may require the student to choose and interpret the scale in a
    graph

    Items may require the student to choose and interpret units..

Sample Test Items (1)
  • Test Item #: Sample Item 1
  • Question:

    A company creates the equation y = 11.26x-76.1 to model the relationship between the number of pages in its catalog and the number of orders, in thousands, that were received. 

    To determine how well the equation models the relationship, the company plots the residuals as shown.

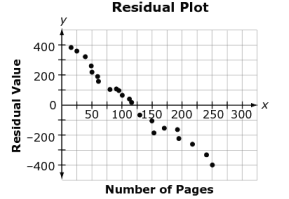
    Why is the equation not a good model for the relationship?

    Type your answer in the space provided.

  • Difficulty: N/A
  • Type: OR: Open Response

Related Courses

This benchmark is part of these courses.
1200310: Algebra 1 (Specifically in versions: 2014 - 2015, 2015 - 2022, 2022 and beyond (current))
1200320: Algebra 1 Honors (Specifically in versions: 2014 - 2015, 2015 - 2022, 2022 and beyond (current))
1200380: Algebra 1-B (Specifically in versions: 2014 - 2015, 2015 - 2022, 2022 and beyond (current))
1200400: Foundational Skills in Mathematics 9-12 (Specifically in versions: 2014 - 2015, 2015 - 2022, 2022 and beyond (current))
1210300: Probability and Statistics Honors (Specifically in versions: 2014 - 2015, 2015 - 2019, 2019 - 2022, 2022 and beyond (current))
2000350: Anatomy and Physiology (Specifically in versions: 2014 - 2015, 2015 - 2022, 2022 and beyond (current))
2000360: Anatomy and Physiology Honors (Specifically in versions: 2014 - 2015, 2015 - 2022, 2022 and beyond (current))
2020910: Astronomy Solar/Galactic Honors (Specifically in versions: 2014 - 2015, 2015 - 2022, 2022 and beyond (current))
2000330: Biology 2 Honors (Specifically in versions: 2014 - 2015, 2015 - 2018, 2018 - 2022, 2022 and beyond (current))
2003340: Chemistry 1 (Specifically in versions: 2014 - 2015, 2015 - 2022, 2022 and beyond (current))
2003350: Chemistry 1 Honors (Specifically in versions: 2014 - 2015, 2015 - 2022, 2022 and beyond (current))
2003360: Chemistry 2 Honors (Specifically in versions: 2014 - 2015, 2015 - 2022, 2022 and beyond (current))
2001320: Earth/Space Science Honors (Specifically in versions: 2014 - 2015, 2015 - 2022, 2022 and beyond (current))
2000440: Genetics Honors (Specifically in versions: 2014 - 2015, 2015 - 2022, 2022 and beyond (current))
2002410: Integrated Science 1 Honors (Specifically in versions: 2014 - 2015, 2015 - 2022, 2022 and beyond (current))
2002430: Integrated Science 2 Honors (Specifically in versions: 2014 - 2015, 2015 - 2022, 2022 and beyond (current))
2002450: Integrated Science 3 Honors (Specifically in versions: 2014 - 2015, 2015 - 2022, 2022 and beyond (current))
2002510: Marine Science 1 Honors (Specifically in versions: 2014 - 2015, 2015 - 2022, 2022 and beyond (current))
2002520: Marine Science 2 (Specifically in versions: 2014 - 2015, 2015 - 2022, 2022 and beyond (current))
2002530: Marine Science 2 Honors (Specifically in versions: 2014 - 2015, 2015 - 2022, 2022 and beyond (current))
2003400: Nuclear Radiation (Specifically in versions: 2014 - 2015, 2015 - 2018 (course terminated))
2020710: Nuclear Radiation Honors (Specifically in versions: 2014 - 2015, 2015 - 2022, 2022 and beyond (current))
2003320: Physical Science Honors (Specifically in versions: 2014 - 2015, 2015 - 2022, 2022 and beyond (current))
2003390: Physics 1 Honors (Specifically in versions: 2014 - 2015, 2015 - 2022, 2022 and beyond (current))
2003410: Physics 2 Honors (Specifically in versions: 2014 - 2015, 2015 - 2022, 2022 and beyond (current))
2002540: Solar Energy Honors (Specifically in versions: 2014 - 2015, 2015 - 2022, 2022 and beyond (current))
1200500: Advanced Algebra with Financial Applications (Specifically in versions: 2014 - 2015 (course terminated))
1200410: Mathematics for College Success (Specifically in versions: 2014 - 2015, 2015 - 2022 (course terminated))
1200700: Mathematics for College Algebra (Specifically in versions: 2014 - 2015, 2015 - 2022 (course terminated))
7912090: Access Algebra 1B (Specifically in versions: 2014 - 2015, 2015 - 2018, 2018 - 2019, 2019 - 2022, 2022 and beyond (current))
7920011: Access Chemistry 1 (Specifically in versions: 2014 - 2015, 2015 - 2018, 2018 - 2023, 2023 and beyond (current))
2000500: Bioscience 1 Honors (Specifically in versions: 2014 - 2015, 2015 - 2022, 2022 - 2023, 2023 and beyond (current))
2000510: Bioscience 2 Honors (Specifically in versions: 2014 - 2015, 2015 - 2022, 2022 - 2023, 2023 and beyond (current))
2000520: Bioscience 3 Honors (Specifically in versions: 2014 - 2015, 2015 - 2022, 2022 - 2023, 2023 and beyond (current))
2003345: Chemistry 1 for Credit Recovery (Specifically in versions: 2014 - 2015, 2015 - 2022, 2022 and beyond (current))
1200315: Algebra 1 for Credit Recovery (Specifically in versions: 2014 - 2015, 2015 - 2022, 2022 and beyond (current))
1200385: Algebra 1-B for Credit Recovery (Specifically in versions: 2014 - 2015, 2015 - 2022, 2022 and beyond (current))
7912100: Fundamental Algebraic Skills (Specifically in versions: 2013 - 2015, 2015 - 2017 (course terminated))
7912075: Access Algebra 1 (Specifically in versions: 2014 - 2015, 2015 - 2018, 2018 - 2019, 2019 - 2022, 2022 and beyond (current))
2100365: African History Honors (Specifically in versions: 2015 - 2022, 2022 and beyond (current))
2003836: Florida's Preinternational Baccalaureate Physics 1 (Specifically in versions: 2015 - 2022, 2022 and beyond (current))
2003838: Florida's Preinternational Baccalaureate Physics 2 (Specifically in versions: 2015 and beyond (current))
1200387: Mathematics for Data and Financial Literacy (Specifically in versions: 2016 and beyond (current))

Related Access Points

Alternate version of this benchmark for students with significant cognitive disabilities.

Related Resources

Vetted resources educators can use to teach the concepts and skills in this benchmark.

Formative Assessments

Residuals:

Students are asked to compute, graph, and interpret the residuals associated with a line of best fit.

Type: Formative Assessment

Swimming Predictions:

Students are asked to use a linear model to make and interpret predictions in the context of the data.

Type: Formative Assessment

House Prices:

Students are asked to informally fit a line to model the relationship between two quantitative variables in a scatterplot, write the equation of the line, and use it to make a prediction.

Type: Formative Assessment

Fit a Function:

Students are given a set of data and are asked to use technology to create a scatter plot and write a function that fits the data set.

Type: Formative Assessment

Lesson Plans

Sea Ice Analysis:

The changing climate is an important topic for both scientific analysis and worldly knowledge. This lesson uses data collected by the National Snow and Ice Data Center to create and use mathematical models as a predictive tool and do critical analysis of sea ice loss.

Type: Lesson Plan

A Day at the Park:

In this activity, students investigate a set of bivariate data to determine if there is a relationship between concession sales in the park and temperature. Students will construct a scatter plot, model the relationship with a linear function, write the equation of the function, and use it to make predictions about values of variables.

Type: Lesson Plan

You Can Plot it! Bivariate Data:

Students create scatter plots, calculate a regression equation using technology, and interpret the slope and y-intercept of the equation in the context of the data. This review lesson relates graphical and algebraic representations of bivariate data.

Type: Lesson Plan

How Hot Is It?:

This lesson allows the students to connect the science of cricket chirps to mathematics. In this lesson, students will collect real data using the CD "Myths and Science of Cricket Chirps" (or use supplied data), display the data in a graph, and then find and use the mathematical model that fits their data.

Type: Lesson Plan

What happens to available energy as it moves through an ecosystem?:

This activity is a lab exercise where students look at the passing of water in cups and compare it to the loss of available energy as it moves through an ecosystem. Students will collect data, calculate efficiency, graph the data and respond to reflection questions to connect the data to what happens in an ecosystem. The end of the activity includes a connection to the 10% rule where only 10% of energy from one trophic level is available at the next level.

Type: Lesson Plan

Span the Distance Glider - Correlation Coefficient:

This lesson will provide students with an opportunity to collect and analyze bivariate data and use technology to create scatter plots, lines of best fit, and determine the correlation strength of the data being compared. Students will have a hands on inquire based lesson that allows them to create gliders to analyze data. This lesson is an application of skills acquired in a bivariate unit of study.

Type: Lesson Plan

Scatter Plots:

This lesson is an introduction to scatterplots and how to use a trend line to make predictions. Students should have some knowledge of graphing bivariate data prior to this lesson.

Type: Lesson Plan

Study of Crowd Ratings at Disney:

In this lesson, students develop a strong use of the vocabulary of correlation by investigating crowd ratings at Disney. Students will determine weekly crowd rating regression lines and correlations and discuss what this means for a Disney visit.

Type: Lesson Plan

Hand Me Your Data:

Students will gather and use data to calculate a line of fit and the correlation coefficient with their classmates' height and hand size. They will use their line of fit to make approximations.

Type: Lesson Plan

What Will I Pay?:

Who doesn't want to save money? In this lesson, students will learn how a better credit score will save them money. They will use a scatter plot to see the relationship between credit scores and car loan interest rates. They will determine a line of fit equation and interpret the slope and y-intercept to make conclusions about interest and credit scores.

Type: Lesson Plan

Calculating Residuals and Constructing a Residual Plot with Soccer Seats:

Students will learn all about residuals. The definition, how to calculate them, how to plot and analyze residuals, and how to use them to assess the fit of a linear function. They will do this within the context of comparing the location of a seat in a soccer stadium with its price.

Type: Lesson Plan

An Introduction to Finding Residuals:

Students will calculate the residuals of two-variable data. Teachers are provided with materials to review, present, practice, and assess students for this new topic. This is an introductory lesson and could be used before teaching residual plots.

Type: Lesson Plan

Why do I have to have a bedtime?:

This predict, observe, explain lesson that allows students to make predictions based on prior knowledge, observations, discussions, and calculations. Students will receive the opportunity to express themselves and their ideas while explaining what they learned. Students will make a prediction, collect data, and construct a scatter plot. Next, students will calculate the correlation coefficient and use it to describe the strength and magnitude of a relationship.

Type: Lesson Plan

Steel vs. Wooden Roller Coaster Lab:

This lesson is a Follow Up Activity to the Algebra Institute and allows students to apply their skills on analyzing bivariate data. This STEM lesson allows students the opportunity to investigate if there is a linear relationship between a coaster's height and speed. Using technology the students can determine the line of best fit, correlation coefficient and use the line for interpolation. This lesson also uses prior knowledge and has students solve systems of equations graphically to determine which type of coaster is faster.

Type: Lesson Plan

Height Arm Juxtaposition:

This lesson is a Follow Up Activity to the Algebra Institute and allows students to apply their skills on analyzing bivariate data. This STEM lesson allows students the opportunity to investigate if there is a linear relationship between a person's height and arm length. Using technology the students will explore in-depth how to perform a least square regression as a procedure for determining the line of best fit.

Type: Lesson Plan

Height Scatterplot Lab:

This lesson is a Follow Up Activity to the Algebra Institute and allows students to apply their skills on analyzing bivariate data. This STEM lesson allows students the opportunity to investigate if there is a linear relationship between a person's height and foot length. Using technology the students can determine the line of best fit, correlation coefficient and use the line for interpolation.

Type: Lesson Plan

Does It Fit?:

The students are asked to create a scatter plot of Bennie's height, determine an equation of best fit, calculate residuals and create a residual plot. The students are then asked to use the residual plot to determine if a linear model is the best predictor of the data.

Type: Lesson Plan

Is My Model Working?:

Students will enjoy this project lesson that allows them to choose and collect their own data. They will create a scatter plot and find the line of fit. Next they write interpretations of their slope and y-intercept. Their final challenge is to calculate residuals and conclude whether or not their data is consistent with their linear model.

Type: Lesson Plan

Fit Your Function:

Students will make a scatter plot and then create a line of fit for the data. From their graph, students will make predictions and describe relationships between the variables. Students will make predictions, inquire, and formulate ideas from observations and discussions.

Type: Lesson Plan

Quantitative or Qualitative?:

This lesson examines the differences between quantitative and qualitative data and guides students through displaying quantitative data on a scatter plot and then separating the data into qualitative categories to be displayed and interpreted in a two-way frequency table.

Type: Lesson Plan

Mass Mole Relationships: A Statistical Approach To Accuracy and Precision:

The lesson is a laboratory-based activity involving measurement, accuracy and precision, stoichiometry and a basic statistical analysis of data using a scatter plot, linear equation, and linear regression (line of best fit). The lesson includes teacher-led discussions with student participation and laboratory-based group activities.

Type: Lesson Plan

Doggie Data: It's a Dog's Life:

Students use real-world data to construct and interpret scatter plots using technology. Students will create a scatter plot with a line of fit and a function. They describe the relationship of bivariate data. They recognize and interpret the slope and y-intercept of the line of fit within the context of the data.

Type: Lesson Plan

Devising a Measure for Correlation:

This lesson unit is intended to help you assess how well students understand the notion of correlation. In particular this unit aims to identify and help students who have difficulty in understanding correlation as the degree of fit between two variables, making a mathematical model of a situation, testing and improving the model, communicating their reasoning clearly and evaluating alternative models of the situation.

Type: Lesson Plan

Hybrid-Electric Vehicles vs. Gasoline-Powered Vehicles:

Students will be comparing hybrid-electric vehicles (HEV) versus gasoline-powered vehicles. They will research the benefits of owning a HEV while also analyzing the cost effectiveness.

Model Eliciting Activities, MEAs, are open-ended, interdisciplinary problem-solving activities that are meant to reveal students’ thinking about the concepts embedded in realistic situations. Click here to learn more about MEAs and how they can transform your classroom.

Type: Lesson Plan

Scatter plots, spaghetti, and predicting the future:

Students will construct a scatter plot from given data. They will identify the correlation, sketch an approximate line of fit, and determine an equation for the line of fit. They will explain the meaning of the slope and y-intercept in the context of the data and use the line of fit to interpolate and extrapolate values.

Type: Lesson Plan

Shake it up:

Students will model molecular motion with everyday materials (shaker bottles) then associate their model/actions to the phase transitions of water while graphing its heat curve from data collected during a structured inquiry lab.

Type: Lesson Plan

Perspectives Video: Experts

Birdsong Series: Statistical Analysis of Birdsong:

Wei Wu discusses his statistical contributions to the Birdsong project which help to quantify the differences in the changes of the zebra finch's song.

Type: Perspectives Video: Expert

Assessment of Past and Present Rates of Sea Level Change:

In this video, Brad Rosenheim describes how Louisiana sediment cores are used to estimate sea level changes over the last 10,000 years. Video funded by NSF grant #: OCE-1502753.

Type: Perspectives Video: Expert

Mathematically Exploring the Wakulla Caves:

The tide is high! How can we statistically prove there is a relationship between the tides on the Gulf Coast and in a fresh water spring 20 miles from each other?

Download the CPALMS Perspectives video student note taking guide.

Type: Perspectives Video: Expert

MicroGravity Sensors & Statistics:

Statistical analysis played an essential role in using microgravity sensors to determine location of caves in Wakulla County.

Download the CPALMS Perspectives video student note taking guide.

Type: Perspectives Video: Expert

Perspectives Video: Professional/Enthusiasts

Determining Strengths of Shark Models based on Scatterplots and Regression:

Chip Cotton, fishery biologist, discusses his use of mathematical regression modeling and how well the data fits his models based on his deep sea shark research.

Download the CPALMS Perspectives video student note taking guide.

Type: Perspectives Video: Professional/Enthusiast

Slope and Deep Sea Sharks:

Shark researcher, Chip Cotton, discusses the use of regression lines, slope, and determining the strength of the models he uses in his research.

Download the CPALMS Perspectives video student note taking guide.

Type: Perspectives Video: Professional/Enthusiast

Mathematically Modeling Eddy Shedding :

COAPS oceanographer Dmitry Dukhovskoy describes the process used to mathematically model eddy shedding in the Gulf of Mexico.

Type: Perspectives Video: Professional/Enthusiast

Residuals and Laboratory Standards:

Laws and regulations that affect the public are being formed based on data from a variety of laboratories. How can we be sure that the laboratories are all standardized?

Type: Perspectives Video: Professional/Enthusiast

Analyzing Wildlife Data Trends with Regression :

Dr. Bill McShea from the Smithsonian Institution discusses how regression analysis helps in his research.

This video was created in collaboration with the Okaloosa County SCIENCE Partnership, including the Smithsonian Institution and Harvard University.

Type: Perspectives Video: Professional/Enthusiast

Problem-Solving Task

Coffee and Crime:

This problem solving task asks students to examine the relationship between shops and crimes by using a correlation coefficient. The implications of linking correlation with causation are discussed.

Type: Problem-Solving Task

Professional Development

Least Squares Regression and Residuals:

Students in a first Algebra course model the relationship between two variables by fitting functions to data. The focus of this tutorial is on (1) using technology to create a scatterplot of data and calculate the equation of the least squares regression line and (2) informally assessing the fit of a function fitted to data by calculating, graphing, and analyzing residuals.

Type: Professional Development

Teaching Ideas

Now That is a Dense Graph:

Students will first measure and plot the total mass vs liquid volume in a graduated cylinder. They will then use slope and the mathematical formula for the plot to determine the density of the liquid, the density of a solid added to the liquid, and the mass of the graduated cylinder.

Type: Teaching Idea

Now That is a Dense Graph:

In this activity, the density of ethanol is found by graphical means. In the second part, the density of sodium thiosulfate is found, also by graphical means. The values found are then analyzed statistically.

Type: Teaching Idea

Tutorial

Fitting Functions to Data:

In a variety of fields, functions are used to mathematically model bivariate data in order to describe, understand, and make predictions about the relationship between two variables. The focus of this tutorial is on (1) teaching students how to model the relationships between two variables with linear and exponential functions and (2) using models to make predictions about values of variables.

Type: Tutorial

Unit/Lesson Sequence

Sample Algebra 1 Curriculum Plan Using CMAP:

This sample Algebra 1 CMAP is a fully customizable resource and curriculum-planning tool that provides a framework for the Algebra 1 Course. The units and standards are customizable and the CMAP allows instructors to add lessons, worksheets, and other resources as needed. This CMAP also includes rows that automatically filter and display Math Formative Assessments System tasks, E-Learning Original Student Tutorials and Perspectives Videos that are aligned to the standards, available on CPALMS.

Learn more about the sample Algebra 1 CMAP, its features and customizability by watching the following video:

Using this CMAP

To view an introduction on the CMAP tool, please .

To view the CMAP, click on the "Open Resource Page" button above; be sure you are logged in to your iCPALMS account.

To use this CMAP, click on the "Clone" button once the CMAP opens in the "Open Resource Page." Once the CMAP is cloned, you will be able to see it as a class inside your iCPALMS My Planner (CMAPs) app.

To access your My Planner App and the cloned CMAP, click on the iCPALMS tab in the top menu.

All CMAP tutorials can be found within the iCPALMS Planner App or at the following URL: http://www.cpalms.org/support/tutorials_and_informational_videos.aspx

Type: Unit/Lesson Sequence

Video/Audio/Animation

Fitting a Line to Data:

Khan Academy tutorial video that demonstrates with real-world data the use of Excel spreadsheet to fit a line to data and make predictions using that line.

Type: Video/Audio/Animation

Virtual Manipulatives

Data Flyer:

Using this virtual manipulative, students are able to graph a function and a set of ordered pairs on the same coordinate plane. The constants, coefficients, and exponents can be adjusted using slider bars, so the student can explore the affect on the graph as the function parameters are changed. Students can also examine the deviation of the data from the function. This activity includes supplemental materials, including background information about the topics covered, a description of how to use the application, and exploration questions for use with the java applet.

Type: Virtual Manipulative

Advanced Data Grapher:

This is an online graphing utility that can be used to create box plots, bubble graphs, scatterplots, histograms, and stem-and-leaf plots.

Type: Virtual Manipulative

STEM Lessons - Model Eliciting Activity

Hybrid-Electric Vehicles vs. Gasoline-Powered Vehicles:

Students will be comparing hybrid-electric vehicles (HEV) versus gasoline-powered vehicles. They will research the benefits of owning a HEV while also analyzing the cost effectiveness.

Model Eliciting Activities, MEAs, are open-ended, interdisciplinary problem-solving activities that are meant to reveal students’ thinking about the concepts embedded in realistic situations. Click here to learn more about MEAs and how they can transform your classroom.

MFAS Formative Assessments

Fit a Function:

Students are given a set of data and are asked to use technology to create a scatter plot and write a function that fits the data set.

House Prices:

Students are asked to informally fit a line to model the relationship between two quantitative variables in a scatterplot, write the equation of the line, and use it to make a prediction.

Residuals:

Students are asked to compute, graph, and interpret the residuals associated with a line of best fit.

Swimming Predictions:

Students are asked to use a linear model to make and interpret predictions in the context of the data.

Student Resources

Vetted resources students can use to learn the concepts and skills in this benchmark.

Perspectives Video: Experts

Mathematically Exploring the Wakulla Caves:

The tide is high! How can we statistically prove there is a relationship between the tides on the Gulf Coast and in a fresh water spring 20 miles from each other?

Download the CPALMS Perspectives video student note taking guide.

Type: Perspectives Video: Expert

MicroGravity Sensors & Statistics:

Statistical analysis played an essential role in using microgravity sensors to determine location of caves in Wakulla County.

Download the CPALMS Perspectives video student note taking guide.

Type: Perspectives Video: Expert

Problem-Solving Task

Coffee and Crime:

This problem solving task asks students to examine the relationship between shops and crimes by using a correlation coefficient. The implications of linking correlation with causation are discussed.

Type: Problem-Solving Task

Video/Audio/Animation

Fitting a Line to Data:

Khan Academy tutorial video that demonstrates with real-world data the use of Excel spreadsheet to fit a line to data and make predictions using that line.

Type: Video/Audio/Animation

Virtual Manipulatives

Data Flyer:

Using this virtual manipulative, students are able to graph a function and a set of ordered pairs on the same coordinate plane. The constants, coefficients, and exponents can be adjusted using slider bars, so the student can explore the affect on the graph as the function parameters are changed. Students can also examine the deviation of the data from the function. This activity includes supplemental materials, including background information about the topics covered, a description of how to use the application, and exploration questions for use with the java applet.

Type: Virtual Manipulative

Advanced Data Grapher:

This is an online graphing utility that can be used to create box plots, bubble graphs, scatterplots, histograms, and stem-and-leaf plots.

Type: Virtual Manipulative

Parent Resources

Vetted resources caregivers can use to help students learn the concepts and skills in this benchmark.

Problem-Solving Task

Coffee and Crime:

This problem solving task asks students to examine the relationship between shops and crimes by using a correlation coefficient. The implications of linking correlation with causation are discussed.

Type: Problem-Solving Task

Video/Audio/Animation

Fitting a Line to Data:

Khan Academy tutorial video that demonstrates with real-world data the use of Excel spreadsheet to fit a line to data and make predictions using that line.

Type: Video/Audio/Animation