MAFS.6.SP.2.5Archived Standard

Summarize numerical data sets in relation to their context, such as by:
  1. Reporting the number of observations.
  2. Describing the nature of the attribute under investigation, including how it was measured and its units of measurement.
  3. Giving quantitative measures of center (median and/or mean) and variability (interquartile range and/or mean absolute deviation), as well as describing any overall pattern and any striking deviations from the overall pattern with reference to the context in which the data were gathered.
  4. Relating the choice of measures of center and variability to the shape of the data distribution and the context in which the data were gathered.
General Information
Subject Area: Mathematics
Grade: 6
Domain-Subdomain: Statistics & Probability
Cluster: Level 3: Strategic Thinking & Complex Reasoning
Cluster: Summarize and describe distributions. (Additional Cluster) -

Clusters should not be sorted from Major to Supporting and then taught in that order. To do so would strip the coherence of the mathematical ideas and miss the opportunity to enhance the major work of the grade with the supporting clusters.

Date Adopted or Revised: 02/14
Date of Last Rating: 02/14
Status: State Board Approved - Archived
Assessed: Yes
Test Item Specifications

  • Assessment Limits :
    Displays should include only dot/line plots, box plots, or histograms.
  • Calculator :

    No

  • Context :

    Required

Sample Test Items (5)
  • Test Item #: Sample Item 1
  • Question: Tim drives the Grand Avenue bus route. The total number of people who ride the bus each week for 5 weeks is shown in the data table.


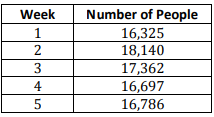
    What is the range of the number of people who ride the bus each week?

  • Difficulty: N/A
  • Type: EE: Equation Editor

  • Test Item #: Sample Item 2
  • Question: Alex found the mean number of food cans that were donated by students for the canned food drive at Epping Middle School. Alex’s work is shown.


    begin mathsize 12px style fraction numerator space 1 plus space 2 space plus space 5 space plus space 3 space plus space 6 space plus space 1 space plus space 4 space plus space 4 space plus space 2 space plus space 1 space plus space 2 space plus space 3 space plus space 7 space plus space 2 space plus space 4 space plus space 1 over denominator 16 end fraction equals 3 end style

    How many students donated food cans?

  • Difficulty: N/A
  • Type: EE: Equation Editor

  • Test Item #: Sample Item 3
  • Question: Tim drives the Grand Avenue bus route. The total number of people who ride the bus each week for 5 weeks is shown in the data table.


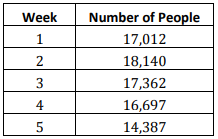
    What is the interquartile range of the data?

  • Difficulty: N/A
  • Type: EE: Equation Editor

  • Test Item #: Sample Item 4
  • Question: A dot plot shows the number of cans students at Epping Middle School collected for a canned food drive.


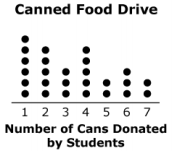
    Select all the options that describe the best measure of center to represent the data in the dot plot. 


  • Difficulty: N/A
  • Type: MS: Multiselect

  • Test Item #: Sample Item 5
  • Question: A line plot shows the number of cans a class of students at Epping Middle School collected for a canned food drive.


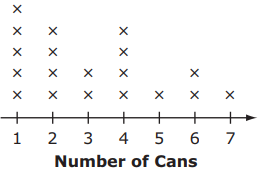
    How many students collected cans of food?

  • Difficulty: N/A
  • Type: EE: Equation Editor

Related Courses

This benchmark is part of these courses.
1205010: M/J Grade 6 Mathematics (Specifically in versions: 2014 - 2015, 2015 - 2022, 2022 and beyond (current))
1205020: M/J Accelerated Mathematics Grade 6 (Specifically in versions: 2014 - 2015, 2015 - 2020, 2020 - 2022, 2022 and beyond (current))
2002040: M/J Comprehensive Science 1 (Specifically in versions: 2014 - 2015, 2015 - 2022, 2022 and beyond (current))
2002050: M/J Comprehensive Science 1, Advanced (Specifically in versions: 2014 - 2015, 2015 - 2022, 2022 and beyond (current))
2001010: M/J Earth/Space Science (Specifically in versions: 2014 - 2015, 2015 - 2022, 2022 and beyond (current))
2001020: M/J Earth/Space Science, Advanced (Specifically in versions: 2014 - 2015, 2015 - 2022, 2022 and beyond (current))
2000010: M/J Life Science (Specifically in versions: 2014 - 2015, 2015 - 2022, 2022 and beyond (current))
2000020: M/J Life Science, Advanced (Specifically in versions: 2014 - 2015, 2015 - 2022, 2022 and beyond (current))
2003010: M/J Physical Science (Specifically in versions: 2014 - 2015, 2015 - 2022, 2022 and beyond (current))
1204000: M/J Foundational Skills in Mathematics 6-8 (Specifically in versions: 2014 - 2015, 2015 - 2022, 2022 and beyond (current))
2100010: M/J United States History (Specifically in versions: 2014 - 2015, 2015 - 2018, 2018 - 2022, 2022 - 2023, 2023 and beyond (current))
2100015: M/J United States History & Career Planning (Specifically in versions: 2014 - 2015, 2015 - 2019, 2019 - 2022, 2022 - 2023, 2023 and beyond (current))
2100020: M/J United States History Advanced (Specifically in versions: 2014 - 2015, 2015 - 2018, 2018 - 2022, 2022 - 2023, 2023 and beyond (current))
2100025: M/J United States History Advanced & Career Planning (Specifically in versions: 2014 - 2015, 2015 - 2019, 2019 - 2022, 2022 - 2023, 2023 and beyond (current))
2100030: M/J Florida History (Specifically in versions: 2014 - 2015, 2015 - 2022, 2022 - 2023, 2023 and beyond (current))
2103010: M/J World Geography (Specifically in versions: 2014 - 2015, 2015 - 2022, 2022 - 2023, 2023 and beyond (current))
2103015: M/J World Geography (Specifically in versions: 2014 - 2015, 2015 - 2022, 2022 - 2023, 2023 and beyond (current))
2103016: M/J World Geography & Career Planning (Specifically in versions: 2014 - 2015, 2015 - 2019, 2019 - 2022, 2022 - 2023, 2023 and beyond (current))
2103020: M/J World Geography, Advanced (Specifically in versions: 2014 - 2015, 2015 - 2022, 2022 - 2023, 2023 and beyond (current))
2103030: M/J Geography: Asia, Oceania, Africa (Specifically in versions: 2014 - 2015, 2015 - 2022, 2022 - 2023, 2023 and beyond (current))
2104000: M/J Social Studies (Specifically in versions: 2014 - 2015, 2015 - 2022, 2022 - 2023, 2023 and beyond (current))
2105020: M/J World Cultures (Specifically in versions: 2014 - 2015, 2015 - 2022, 2022 - 2023, 2023 and beyond (current))
2105025: M/J World Cultures & Career Planning (Specifically in versions: 2014 - 2015, 2015 - 2019, 2019 - 2022, 2022 - 2023, 2023 and beyond (current))
2109010: M/J World History (Specifically in versions: 2014 - 2015, 2015 - 2022, 2022 - 2023, 2023 and beyond (current))
2109020: M/J World History, Advanced (Specifically in versions: 2014 - 2015, 2015 - 2022, 2022 - 2023, 2023 and beyond (current))
7812015: Access M/J Grade 6 Mathematics (Specifically in versions: 2014 - 2015, 2015 - 2018, 2018 - 2022, 2022 and beyond (current))
7820015: Access M/J Comprehensive Science 1 (Specifically in versions: 2014 - 2015, 2015 - 2018, 2018 - 2023, 2023 and beyond (current))
2103017: M/J World Geography and Digital Technologies (Specifically in versions: 2014 - 2015, 2015 - 2022, 2022 - 2023, 2023 and beyond (current))
2104010: M/J Engaged Citizenship through Service Learning 1 (Specifically in versions: 2014 - 2015, 2015 - 2022, 2022 - 2023, 2023 and beyond (current))
2104020: M/J Engaged Citizenship through Service Learning 2 (Specifically in versions: 2014 - 2015, 2015 - 2022, 2022 - 2023, 2023 and beyond (current))
2100045: M/J United States History & Civics (Specifically in versions: 2014 - 2015, 2015 - 2022, 2022 - 2023, 2023 and beyond (current))
7912110: Fundamental Explorations in Mathematics 1 (Specifically in versions: 2013 - 2015, 2015 - 2017 (course terminated))
2003030: M/J STEM Physical Science (Specifically in versions: 2015 - 2022, 2022 and beyond (current))
2002200: M/J STEM Environmental Science (Specifically in versions: 2015 - 2022, 2022 and beyond (current))
2001025: M/J STEM Astronomy and Space Science (Specifically in versions: 2015 - 2022, 2022 and beyond (current))
2000025: M/J STEM Life Science (Specifically in versions: 2015 - 2022, 2022 and beyond (current))

Related Access Points

Alternate version of this benchmark for students with significant cognitive disabilities.

Related Resources

Vetted resources educators can use to teach the concepts and skills in this benchmark.

Formative Assessments

Quiz Mean and Deviation:

Students are asked to calculate measures of center and variability, identify outliers, and interpret the meaning of each in context.

Type: Formative Assessment

Florida Lakes:

Students are given a histogram and are asked to describe the variable under investigation and the number of observations.

Type: Formative Assessment

Select the Better Measure:

Students are asked to select the better measure of center and variability to describe each of two distributions of data.

Type: Formative Assessment

Analyzing Physical Activity:

Students are asked to calculate measures of center and variability, identify extreme values, and interpret the meaning of each in context.

Type: Formative Assessment

Lesson Plans

Voter Task Force:

Students will help the Supervisor of Elections determine which voter registration locations could be improved to help more citizens get registered to vote. Students will learn about the number of citizens who registered to vote in a general election year compared to the total population of those eligible to vote. They will discuss which voter registration locations will provide the most access to citizens and allocate funds to help address the issue in this modeling eliciting activity.

Model Eliciting Activities, MEAs, are open-ended, interdisciplinary problem-solving activities that are meant to reveal students’ thinking about the concepts embedded in realistic situations. Click here to learn more about MEAs and how they can transform your classroom.


Type: Lesson Plan

Sea Ice Analysis Grade 6:

The changing climate is an important topic for both scientific analysis and worldly knowledge. This lesson uses data collected by the National Snow and Ice Data Center to create and use statistical analysis as a tool to evaluate the mean and variation from the mean of sea ice loss.

Type: Lesson Plan

Sensoring Data:

In this follow up lesson, students will explore data collection using the weather station sensor and perform statistical analysis of the data. Students will use a scientific method of inquiry to plan an investigation of their own. This activity is meant to allow students to use a variety of skills they have acquired throughout a statistics unit in a personally meaningful way.

Type: Lesson Plan

Measurement and Data Collection:

In this interdisciplinary lesson, students will practice the skill of data collection with a variety of tools and by statistically analyzing the class data sets will begin to understand that error is inherent in all data.

This lesson uses the Hip Sciences Sensor Wand and Temperature Probe. Please refer to the corresponding Hip Science Sensor Guide(s) for information on using the sensor.

Type: Lesson Plan

Cool Special Effects:

In this MEA, students will apply the concepts of heat transfer, especially convection. Students will analyze factors such as temperature that affect the behavior of fluids as they form convection currents.

Model Eliciting Activities, MEAs, are open-ended, interdisciplinary problem-solving activities that are meant to reveal students’ thinking about the concepts embedded in realistic situations. Click here to learn more about MEAs and how they can transform your classroom.

Type: Lesson Plan

Measurement Data Error:

In this interdisciplinary lesson, students will practice the skill of data collection with a variety of tools and by statistically analyzing the class data sets will begin to understand that error is inherent in all data.

Type: Lesson Plan

Measurement and Data Collection:

In this interdisciplinary lesson, students will practice the skill of data collection with a variety of tools and by statistically analyzing the class data sets will begin to understand that error is inherent in all data.

This lesson uses the Hip Sciences Sensor Wand and Temperature Probe. Please refer to the corresponding Hip Science Sensor Guide(s) for information on using the sensor.

Type: Lesson Plan

Preventing Lake Erosion:

How can you save your house on the lake? This is a three-day activity that will reinforce science skills, math skills, and technology skills by taking the students through the design process to create a solution to the real-world problem of lake erosion.

Type: Lesson Plan

Crash Test Dummies:

Students will investigate inertia and Newton's laws of motion by completing an engineering challenge. Students will first investigate how mass affects the inertia of a person riding in a car that comes to a sudden stop. After analyzing the data and discussing the results, students will be asked to design a seat belt that will keep their clay person in the car without sustaining an "injury."

Type: Lesson Plan

The Penny Lab:

Students will design an investigation to collect and analyze data, determine results, write a justification and make a presentation using U.S. pennies.

Paired student teams will determine the mass of 50 U.S. pennies. Students will also collect other data from each penny such as minted year and observable appearance. Students will be expected to organize/represent their data into tables, histograms and other informational structures appropriate for reporting all data for each penny. Students will be expected to consider the data, determine trends, and research information in order to make a claim that explains trends in data from minted U.S. pennies.

Hopefully, student data reports will support the knowledge that the metallic composition of the penny has changed over the years. Different compositions can have significantly different masses. A sufficiently random selection of hundreds of pennies across the class should allow the students to discover trends in the data to suggest the years in which the composition changed.

Type: Lesson Plan

Sensoring Data:

In this follow up lesson, students will explore data collection using the weather station sensor and perform statistical analysis of the data. Students will use a scientific method of inquiry to plan an investigation of their own. This activity is meant to allow students to use a variety of skills they have acquired throughout a statistics unit in a personally meaningful way.

Type: Lesson Plan

Grapevine Fabrication Part 2:

This lesson is a Follow Up Activity to the Algebra Institute and allows students to collect data to perform basic statistical operations to analyze and make comparisons on variability within a certain brand of raisins. Part 1 must be completed prior to starting Part 2. This investigation can elicit discussion about manufacturing and quality control.

Type: Lesson Plan

Grapevine Fabrication Part 1:

This lesson is a Follow Up Activity to the Algebra Institute and allows students to collect data to perform basic statistical operations to analyze and make comparisons on variability within a certain brand of raisins. Part 1 may be completed without Part 2. This investigation can elicit discussion about manufacturing and quality control.

Type: Lesson Plan

Fun with Surveys: An Activity with Number Sets:

In this activity, students will circulate around the classroom obtaining data from fellow classmates.  Students will pick their own question that will produce numerical responses.  Students will hypothesize the mean, median, and mode, calculate the measures, and identify which measure most accurately represents the data.

Type: Lesson Plan

Stats Rock: Using Pet Rocks to Find the Mean, Median and Interquartile Range (IQR):

Using pet rocks, the students will determine the mean, median and interquartile range (IQR) of the weights of the rocks. A PowerPoint presentation and YouTube videos will introduce and reinforce the concepts of mean, median, and interquartile range (IQR).

Type: Lesson Plan

The Best Things About Quantitative Measures:

Given quantitative measures students will be able to find the all the quantitative measures.

Type: Lesson Plan

Basketball All Star Team:

Students are asked to break down player statistics into percentages to determine the best players to send to an all star team. Students are then requested to write about the procedure used to make their decisions. Students are then asked to rank the players from one to five with one being the top pick.

Model Eliciting Activities, MEAs, are open-ended, interdisciplinary problem-solving activities that are meant to reveal students’ thinking about the concepts embedded in realistic situations. Click here to learn more about MEAs and how they can transform your classroom.

Type: Lesson Plan

Speedster:

In this activity, students will collect data to compare their reaction time for catching a falling object or to an online stimulus to that of their classmates. Students will collect data for their class, construct a graph to represent the data, and then answer the question, "How good are my reactions compared to other students?"

Type: Lesson Plan

The Battle of the Forces:

This lesson is an engaging way to strengthen students understanding of balanced and unbalanced forces and how these forces change an objects direction of motion. Students will participate in an actual tug of war and determine what factors create an unbalanced force. The lesson not only supports science benchmarks but Math and Language Arts as well.

Type: Lesson Plan

Calculating the Mean, Median, Mode, and Range from a Frequency Chart:

This lesson lasts a total of two hours: 15-minute pre-lesson, 90-minute lesson, and 15-minute follow up lesson or homework. Students will need the two worksheets, a mini-whiteboard, a pen, and an eraser. Each small group will need both card sets, a large sheet of paper, and a glue stick. Students will generate responses to a question about favorite computer games and use this data for the lesson. Students will then work collaboratively to display different data and discuss various strategy approaches.

Type: Lesson Plan

Analyzing Data with Bell Curves and Measures of Center:

In this lesson, students learn about data sets and will be able to tell if a bell curve represents a normal distribution and explain why a distribution might be skewed. Students will form their own bell curve and calculate measures of center and variability based on their data, and discuss their findings with the class.

Type: Lesson Plan

Heartbeat in a Box:

This lesson teaches how to make a box plot paying attention to what the quartiles mean. Students find resting heartbeat and active heartbeat. They make observations of this data displayed in box plots on the same number line. Students will interpret and make sense of this data, as well. Outliers are introduced, but not calculated, as is the intent of the standards, at this grade level.

Type: Lesson Plan

Be the Statistician:

Students will utilize their knowledge of data and statistics to create a question, collect numerical data, and create a display of their data driven by its quantitative measures of center and variability; mean, median, mode, and range.

Type: Lesson Plan

The Survey Says...:

Students will work in groups to conduct class surveys, using the results of the survey to calculate various measures of central tendency.

Type: Lesson Plan

Exploring Central Tendency:

Students will review measures of central tendency and practice selecting the best measure with real-world categorical data. This relatable scenario about ranking the characteristics considered when purchasing a pair of sneakers, is used to finally answer the age-old question of "When will I ever use this?".

Type: Lesson Plan

Closest to the Pin!:

Students will create and analyze real world data while representing the data visually and comparing to a larger sample size.

Type: Lesson Plan

Candy Colors: Figuring the Mean, Median & Mode:

In this lesson, students will count candy of different colors and use the data to calculate mean, median, and mode. Groups of students will work together to share their data and calculate the measures of central tendency again. At the end of the lesson, they will apply their learning to another collection of data.

Type: Lesson Plan

Hot, Hot, Hot! Earth's Surface Heating:

Students will explore the concept of the uneven heating and cooling of Earth's surfaces by the Sun by collecting and analyzing data. Outside the classroom, students from several classes will record data points to be analyzed collectively to explore rates of heating and cooling related to time and material properties for air, water, and soil. Students will use mathematical techniques to help answer scientific questions.

Type: Lesson Plan

Original Student Tutorial

Moving MADness:

Learn how to calculate and interpret the Mean Absolute Deviation (MAD) of data sets in this travel-themed, interactive statistics tutorial. 

Type: Original Student Tutorial

Perspectives Video: Professional/Enthusiast

Mean Data and Striking Deviations in Sea Turtle Research:

Dive in and learn about how statistics can be used to help research sea turtles!

Type: Perspectives Video: Professional/Enthusiast

Problem-Solving Tasks

Don’t Spill the Beans!:

The purpose of this task is for students to make a hypothesis, and then doing an experiment to test each students hypothesis. Students will collect and record their data, use graphical methods to describe their data, and finally analyze and interpret their results in the context of the activity.

Type: Problem-Solving Task

Electoral College:

Students are given a context and a dotplot and are asked a number of questions regarding shape, center, and spread of the data.

Type: Problem-Solving Task

Student Center Activity

Edcite: Mathematics Grade 6:

Students can practice answering mathematics questions on a variety of topics. With an account, students can save their work and send it to their teacher when complete.

Type: Student Center Activity

Teaching Ideas

Stem-and-Leaf Plots:

This lesson is designed to introduce students to stem-and-leaf plots as a graphical way to represent a data set. The lesson also reviews measures of central tendency with directions for finding mean, median, and mode are given. This lesson provides links to discussions and activities related to stem-and-leaf plots as well as suggested ways to integrate them into the lesson. Finally, the lesson provides links to follow-up lessons designed for use in succession with the current one.

Type: Teaching Idea

Drops on a Penny (Box-and-Whiskers Graph):

Students collect data, compute measures of central tendency, and create stem-and-leaf plots and box-and-whiskers plots.

Type: Teaching Idea

Text Resource

Hitting Streaks Spread Success:

This informational text resource is intended to support reading in the content area. Although scientists haven't determined a specific reason why one baseball player's hitting streak improves his whole team's performance, they have observed a very real mathematical pattern. There may be many reasons for the phenomenon, but no one has found them out yet.

Type: Text Resource

Tutorials

Mean Absolute Deviation Example:

In this video, you will see two ways to find the Mean Absolute Deviation of a data set.

Type: Tutorial

Find a Missing Value Given the Mean:

This video shows how to find the value of a missing piece of data if you know the mean of the data set.

Type: Tutorial

Video/Audio/Animations

Median and Range Puzzle:

Try these interesting median and range challenge problems!

Type: Video/Audio/Animation

Soybean growth rate response to touch:

A time-lapse video showing differential growth rates for touch-treated seedlings and control seedlings. This would be appropriate for lessons about plant growth responses to environmental stress and graphing growth rate. Plants were grown in a vermiculite soilless medium with calcium-enhanced water. No other minerals or nutrients were used. Plants were grown in a dark room with specially-filtered green light. The plants did not grow by cellular reproduction but only by expansion of existing cells in the hypocotyl region below the 'hook'.
Video contains three plants in total. The first two plants to emerge from the vermiculite medium are the control (right) and treatment (left) plants. A third plant emerges in front of these two but is removed at the time of treatment and is not relevant except to help indicate when treatment was applied (watch for when it disappears). When that plant disappears, the slowed growth rate of the treatment plant is apparent.
Treatment included a gentle flexing of the hypocotyl region of the treatment seedling for approximately 5 seconds. A rubber glove was used at this time to avoid an contamination of the plant tissue.
Some video players allow users to 'scrub' the playback back and forth. This would help teachers or students isolate particular times (as indicated by the watch) and particular measurements (as indicated by the cm scale). A graph could be constructed by first creating a data table and then plotting the data points from the table. Multiple measurements from the video could be taken to create an accurate graph of the plants' growth rates (treatment vs control).
Instructions for graphing usage:
The scale in the video is in centimeters (one cm increments). Students could observe the initial time on the watch in the video and use that observation to represent time (t) = 0. For that value, a mark could be made to indicate the height of the seedlings. As they advance and pause the video repeatedly, the students would mark the time (+2.5 hours for example) and mark the related seedling heights. It is not necessary to advance the video at any regular interval but is necessary to mark the time and related heights as accurately as possible. Students may use different time values and would thus have different data sets but should find that their graphs are very similar. (Good opportunity to collect data from real research and create their own data sets) It is advised that the students collect multiple data points around the time where the seedling growth slows in response to touch to more accurately collect information around that growth rate slowing event. The resulting graph should have an initial growth rate slope, a flatter slope after stress treatment, and a return to approximately the same slope as seen pre-treatment. More data points should yield a more thorough view of this. This would be a good point to discuss. Students can use some of their data points to calculate approximate pre-treatment, immediate post-treatment, and late post-treatment slopes for both the control and treatment seedlings.
This video was created by the submitter and is original content.
Full screen playback should be an option for most video players. Video quality may appear degraded with a larger image but this may aid viewing the watch and scale for data collection.

Type: Video/Audio/Animation

Virtual Manipulative

Box Plot:

In this activity, students use preset data or enter in their own data to be represented in a box plot. This activity allows students to explore single as well as side-by-side box plots of different data. This activity includes supplemental materials, including background information about the topics covered, a description of how to use the application, and exploration questions for use with the Java applet.

Type: Virtual Manipulative

Worksheet

Splash of Math - SeaWorld Classroom Activity:

This resource allows students to assume the role of an ethologist provide 4 activities that challenge students to apply mathematics to solve complex real-life problems:

  • Activity A: Watch the Whales - Determine average speed, distance, and percentage of time at the surface of gray whales.
  • Activity B: Time Tally - From observations of a dolphin determine total time and percentage of time of certain behaviors.
  • Activity C: Deep Divers - Determine average dive depth, diving time, and surface time of an elephant seal.
  • Activity D: Breaches of the Humpback - Graph data and make a prediction from the graph. In this activity, the students will practice problem solving skills to solve complex real-life problems.

Type: Worksheet

STEM Lessons - Model Eliciting Activity

Basketball All Star Team:

Students are asked to break down player statistics into percentages to determine the best players to send to an all star team. Students are then requested to write about the procedure used to make their decisions. Students are then asked to rank the players from one to five with one being the top pick.

Model Eliciting Activities, MEAs, are open-ended, interdisciplinary problem-solving activities that are meant to reveal students’ thinking about the concepts embedded in realistic situations. Click here to learn more about MEAs and how they can transform your classroom.

Cool Special Effects:

In this MEA, students will apply the concepts of heat transfer, especially convection. Students will analyze factors such as temperature that affect the behavior of fluids as they form convection currents.

Model Eliciting Activities, MEAs, are open-ended, interdisciplinary problem-solving activities that are meant to reveal students’ thinking about the concepts embedded in realistic situations. Click here to learn more about MEAs and how they can transform your classroom.

MFAS Formative Assessments

Analyzing Physical Activity:

Students are asked to calculate measures of center and variability, identify extreme values, and interpret the meaning of each in context.

Florida Lakes:

Students are given a histogram and are asked to describe the variable under investigation and the number of observations.

Quiz Mean and Deviation:

Students are asked to calculate measures of center and variability, identify outliers, and interpret the meaning of each in context.

Select the Better Measure:

Students are asked to select the better measure of center and variability to describe each of two distributions of data.

Original Student Tutorials Mathematics - Grades 6-8

Moving MADness:

Learn how to calculate and interpret the Mean Absolute Deviation (MAD) of data sets in this travel-themed, interactive statistics tutorial. 

Student Resources

Vetted resources students can use to learn the concepts and skills in this benchmark.

Original Student Tutorial

Moving MADness:

Learn how to calculate and interpret the Mean Absolute Deviation (MAD) of data sets in this travel-themed, interactive statistics tutorial. 

Type: Original Student Tutorial

Problem-Solving Task

Electoral College:

Students are given a context and a dotplot and are asked a number of questions regarding shape, center, and spread of the data.

Type: Problem-Solving Task

Student Center Activity

Edcite: Mathematics Grade 6:

Students can practice answering mathematics questions on a variety of topics. With an account, students can save their work and send it to their teacher when complete.

Type: Student Center Activity

Tutorials

Mean Absolute Deviation Example:

In this video, you will see two ways to find the Mean Absolute Deviation of a data set.

Type: Tutorial

Find a Missing Value Given the Mean:

This video shows how to find the value of a missing piece of data if you know the mean of the data set.

Type: Tutorial

Virtual Manipulative

Box Plot:

In this activity, students use preset data or enter in their own data to be represented in a box plot. This activity allows students to explore single as well as side-by-side box plots of different data. This activity includes supplemental materials, including background information about the topics covered, a description of how to use the application, and exploration questions for use with the Java applet.

Type: Virtual Manipulative

Parent Resources

Vetted resources caregivers can use to help students learn the concepts and skills in this benchmark.

Problem-Solving Task

Electoral College:

Students are given a context and a dotplot and are asked a number of questions regarding shape, center, and spread of the data.

Type: Problem-Solving Task