MAFS.6.SP.1.2Archived Standard

Understand that a set of data collected to answer a statistical question has a distribution which can be described by its center, spread, and overall shape.
General Information
Subject Area: Mathematics
Grade: 6
Domain-Subdomain: Statistics & Probability
Cluster: Level 2: Basic Application of Skills & Concepts
Cluster: Develop understanding of statistical variability. (Additional Cluster) -

Clusters should not be sorted from Major to Supporting and then taught in that order. To do so would strip the coherence of the mathematical ideas and miss the opportunity to enhance the major work of the grade with the supporting clusters.

Date Adopted or Revised: 02/14
Date of Last Rating: 02/14
Status: State Board Approved - Archived
Assessed: Yes
Test Item Specifications

  • Assessment Limits :
    Circle graphs and line graphs may not be used. Items should include a distribution.
  • Calculator :

    No

  • Context :

    Allowable

Sample Test Items (1)
  • Test Item #: Sample Item 1
  • Question:

    A dot plot is shown.


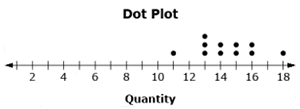
    If the quantities 3 and 4 are added to the data set, how would the distribution be affected? 


  • Difficulty: N/A
  • Type: MC: Multiple Choice

Related Courses

This benchmark is part of these courses.
1205010: M/J Grade 6 Mathematics (Specifically in versions: 2014 - 2015, 2015 - 2022, 2022 and beyond (current))
1205020: M/J Accelerated Mathematics Grade 6 (Specifically in versions: 2014 - 2015, 2015 - 2020, 2020 - 2022, 2022 and beyond (current))
1204000: M/J Foundational Skills in Mathematics 6-8 (Specifically in versions: 2014 - 2015, 2015 - 2022, 2022 and beyond (current))
0800000: M/J Health Grade 6 Year (Specifically in versions: 2014 - 2015, 2015 - 2018, 2018 - 2022, 2022 - 2024 (current), 2024 and beyond)
0800030: M/J Health Grade 6 Semester (Specifically in versions: 2014 - 2015, 2015 - 2018, 2018 - 2022, 2022 - 2024 (current), 2024 and beyond)
2105030: M/J Advanced World Cultures (Specifically in versions: 2014 - 2015, 2015 - 2022, 2022 - 2023, 2023 and beyond (current))
2106015: M/J Civics (Specifically in versions: 2014 - 2015, 2015 - 2022, 2022 - 2023, 2023 and beyond (current))
2106016: M/J Civics & Career Planning (Specifically in versions: 2014 - 2015, 2015 - 2019, 2019 - 2022, 2022 - 2023, 2023 and beyond (current))
2106020: M/J Civics, Advanced (Specifically in versions: 2014 - 2015, 2015 - 2019, 2019 - 2022, 2022 - 2023, 2023 and beyond (current))
2106025: M/J Civics, Advanced (Specifically in versions: 2014 - 2015, 2015 - 2022, 2022 - 2023, 2023 and beyond (current))
2106026: M/J Civics, Advanced & Career Planning (Specifically in versions: 2014 - 2015, 2015 - 2019, 2019 - 2022, 2022 - 2023, 2023 and beyond (current))
2106030: M/J Law Studies (Specifically in versions: 2014 - 2015, 2015 - 2022, 2022 - 2023, 2023 and beyond (current))
7812015: Access M/J Grade 6 Mathematics (Specifically in versions: 2014 - 2015, 2015 - 2018, 2018 - 2022, 2022 and beyond (current))
2106029: M/J Civics and Digital Technologies (Specifically in versions: 2014 - 2015, 2015 - 2022, 2022 - 2023, 2023 and beyond (current))
7912110: Fundamental Explorations in Mathematics 1 (Specifically in versions: 2013 - 2015, 2015 - 2017 (course terminated))
2003030: M/J STEM Physical Science (Specifically in versions: 2015 - 2022, 2022 and beyond (current))
2002200: M/J STEM Environmental Science (Specifically in versions: 2015 - 2022, 2022 and beyond (current))
2001025: M/J STEM Astronomy and Space Science (Specifically in versions: 2015 - 2022, 2022 and beyond (current))
2000025: M/J STEM Life Science (Specifically in versions: 2015 - 2022, 2022 and beyond (current))
2109015: M/J World History and Career Planning (Specifically in versions: 2016 - 2019, 2019 - 2022, 2022 - 2023, 2023 and beyond (current))
2109025: M/J World History, Advanced and Career Planning (Specifically in versions: 2016 - 2019, 2019 - 2022, 2022 - 2023, 2023 and beyond (current))
0800005: M/J Health & Career Planning Grade 6 Year (Specifically in versions: 2019 - 2022, 2022 and beyond (current))
7821024: Access M/J World History and Career Planning (Specifically in versions: 2019 - 2023, 2023 and beyond (current))
0800035: M/J Health Grade 6 Semester and Career Planning (Specifically in versions: 2020 - 2022, 2022 and beyond (current))

Related Access Points

Alternate version of this benchmark for students with significant cognitive disabilities.

Related Resources

Vetted resources educators can use to teach the concepts and skills in this benchmark.

Formative Assessments

Math Test Center:

Students are asked to describe and compare the centers of two data sets given their dot plots.

Type: Formative Assessment

Pet Frequency:

Students are asked to describe the distribution of data given in raw form.

Type: Formative Assessment

Math Test Spread:

Students are asked to describe and compare the spread of the distribution of two data sets given their dot plots.

Type: Formative Assessment

Math Test Shape:

Students are asked to describe the shapes of three distributions given their dot plots and to explain the shapes in terms of the context.

Type: Formative Assessment

Lesson Plans

Climate and Careers!:

Students will explore chosen outdoor careers and how the careers connect to certain climates based on temperature and precipitation. The guiding question states "How might you use evidence from weather data and dot plot displays to allow you to identify which location's climate would be best for your career and why?" Students will collect data online and display the data using dot plots on posters with analysis using the mean. Students will engage in collaboration throughout. A power point is included with all necessary resources.

Type: Lesson Plan

Data Sets Represented in Computers:

This lesson shows how data can be represented by computers, in relation to everyday activities we may not be aware that we use computer. It gives an overview of graphing data by creating a histogram based on population data. Using the data collected, students will get a chance to hand write code to show what structure is needed for computers to collect, analyze and distribute such data. This lesson is lesson 1 of the Data Set and Deviation Statistics Unit and bridges statistical concepts of data collection, graphing and analysis with programming a computer using coding language while reinforcing foundational algebraic skills.

Type: Lesson Plan

Sensoring Data:

In this follow up lesson, students will explore data collection using the weather station sensor and perform statistical analysis of the data. Students will use a scientific method of inquiry to plan an investigation of their own. This activity is meant to allow students to use a variety of skills they have acquired throughout a statistics unit in a personally meaningful way.

Type: Lesson Plan

Measurement and Data Collection:

In this interdisciplinary lesson, students will practice the skill of data collection with a variety of tools and by statistically analyzing the class data sets will begin to understand that error is inherent in all data.

This lesson uses the Hip Sciences Sensor Wand and Temperature Probe. Please refer to the corresponding Hip Science Sensor Guide(s) for information on using the sensor.

Type: Lesson Plan

Measurement Data Error:

In this interdisciplinary lesson, students will practice the skill of data collection with a variety of tools and by statistically analyzing the class data sets will begin to understand that error is inherent in all data.

Type: Lesson Plan

Measurement and Data Collection:

In this interdisciplinary lesson, students will practice the skill of data collection with a variety of tools and by statistically analyzing the class data sets will begin to understand that error is inherent in all data.

This lesson uses the Hip Sciences Sensor Wand and Temperature Probe. Please refer to the corresponding Hip Science Sensor Guide(s) for information on using the sensor.

Type: Lesson Plan

Sensoring Data:

In this follow up lesson, students will explore data collection using the weather station sensor and perform statistical analysis of the data. Students will use a scientific method of inquiry to plan an investigation of their own. This activity is meant to allow students to use a variety of skills they have acquired throughout a statistics unit in a personally meaningful way.

Type: Lesson Plan

May the neutrally buoyant force be with you !:

  • This lesson helps students understand that forces affect motion and that some forces can be manipulated to be balanced or unbalanced with respect to motion. In the lesson, students use their knowledge of types of forces and free body diagrams to do an inquiry activity where they attempt to make a film canister neutrally buoyant in a 10 gal tank full of fresh water. (I have also used 2 L bottles with tops cut off and an empty pie pan to collect spillage.) Students need to predict, observe, and explain along the way as well as collect and record data to help quantify their results.
  • After the lesson, students apply their new knowledge gained through experiential learning to real life scenarios in an abstract way as a formative assessment.

Type: Lesson Plan

Comparing and Contrasting Data Sets Using Measures of Center and Spread:

This lesson is designed to show students how to apply their understanding of data distribution, center, and spread to compare and contrast data sets. The lesson should be covered over two class periods (or one if on a block schedule). In this lesson, students will be asked to:

  • Review important vocabulary and prior knowledge.
  • Make observations from dot plots and data sets.
  • Calculate measures of central tendency (mean, median, mode).
  • Calculate a measure of spread (range).
  • Examine how outliers affect data sets.
  • Complete a group activity and compare results to other groups.
  • Use measures of center and spread to compare/contrast data sets.

Type: Lesson Plan

Statistically Speaking Part II: An Investigation of Statistical Questions and Data Distribution:

This lesson is Part 2 of 2 and uses the inquiry based learning method to help students recognize a statistical question as one that anticipates variability in the data. Through cooperative learning activities, the students will develop an understanding of how to analyze the collected data to answer a statistical question. Students will complete a statistical research project in teams. Since this lesson focuses on math concepts related to identifying clusters, gaps, outliers and overall shape of a line plot, it will help students build a strong foundation for future concepts in the statistics and probability domain. The corresponding lesson is Statistically Speaking Part I: An Investigation of Statistical Questions and Data Distribution, Resource ID 48649.

Type: Lesson Plan

Statistically Speaking Part I: An Investigation of Statistical Questions and Data Distribution:

This lesson is Part 1 of 2 and uses the inquiry-based learning method to help students recognize a statistical question as one that anticipates variability in the data. Through cooperative learning activities, the students will develop an understanding of how to analyze the data collected to answer a statistical question. Since this lesson focuses on math concepts related to identifying clusters, gaps, outliers and overall shape of a line plot, it will help students build a strong foundation for future concepts in the statistics and probability domain. The corresponding lesson Resource ID is: 49091

Type: Lesson Plan

Heartbeat in a Box:

This lesson teaches how to make a box plot paying attention to what the quartiles mean. Students find resting heartbeat and active heartbeat. They make observations of this data displayed in box plots on the same number line. Students will interpret and make sense of this data, as well. Outliers are introduced, but not calculated, as is the intent of the standards, at this grade level.

Type: Lesson Plan

Data Doctors:

Have your students become "Data Doctors" by examining and analyzing means of central tendency. This lesson is a great introduction to mean, median, mode and range. Students will be sets of data, get to work in small groups examining the sets, learn a poem that will help them remember each term and take surveys to get real data sets.

Type: Lesson Plan

Original Student Tutorials

Math Models and Social Distancing:

Learn how math models can show why social distancing during a epidemic or pandemic is important in this interactive tutorial.

Type: Original Student Tutorial

Castles, Catapults and Data: Histograms Part 2:

Learn how to interpret histograms to analyze data, and help an inventor predict the range of a catapult in part 2 of this interactive tutorial series. More specifically, you'll learn to describe the shape and spread of data distributions.

Click HERE to open part 1.

Type: Original Student Tutorial

Problem-Solving Tasks

How Long is 30 Seconds?:

The purpose of this task is for students to gain a better understanding of the passage of time. Students with the help of their teacher should work to design an investigation to find out how successful the class is at predicting when 30 seconds has passed. Once the data is recorded students should begin to graph their findings to make comparisons.

Type: Problem-Solving Task

Electoral College:

Students are given a context and a dotplot and are asked a number of questions regarding shape, center, and spread of the data.

Type: Problem-Solving Task

Puppy Weights:

Using the information provided, create an appropriate graphical display and answer the questions regarding shape, center and variability.

Type: Problem-Solving Task

Teaching Idea

Drops on a Penny (Box-and-Whiskers Graph):

Students collect data, compute measures of central tendency, and create stem-and-leaf plots and box-and-whiskers plots.

Type: Teaching Idea

Tutorial

Shapes of Distributions:

In this video, you will practice describing the shape of distributions as skewed left, skewed right, or symmetrical.

Type: Tutorial

Virtual Manipulative

Histogram Tool:

This virtual manipulative histogram tool can aid in analyzing the distribution of a dataset. It has 6 preset datasets and a function to add your own data for analysis.

Type: Virtual Manipulative

MFAS Formative Assessments

Math Test Center:

Students are asked to describe and compare the centers of two data sets given their dot plots.

Math Test Shape:

Students are asked to describe the shapes of three distributions given their dot plots and to explain the shapes in terms of the context.

Math Test Spread:

Students are asked to describe and compare the spread of the distribution of two data sets given their dot plots.

Pet Frequency:

Students are asked to describe the distribution of data given in raw form.

Original Student Tutorials Mathematics - Grades 6-8

Castles, Catapults and Data: Histograms Part 2:

Learn how to interpret histograms to analyze data, and help an inventor predict the range of a catapult in part 2 of this interactive tutorial series. More specifically, you'll learn to describe the shape and spread of data distributions.

Click HERE to open part 1.

Math Models and Social Distancing:

Learn how math models can show why social distancing during a epidemic or pandemic is important in this interactive tutorial.

Student Resources

Vetted resources students can use to learn the concepts and skills in this benchmark.

Original Student Tutorials

Math Models and Social Distancing:

Learn how math models can show why social distancing during a epidemic or pandemic is important in this interactive tutorial.

Type: Original Student Tutorial

Castles, Catapults and Data: Histograms Part 2:

Learn how to interpret histograms to analyze data, and help an inventor predict the range of a catapult in part 2 of this interactive tutorial series. More specifically, you'll learn to describe the shape and spread of data distributions.

Click HERE to open part 1.

Type: Original Student Tutorial

Problem-Solving Tasks

Electoral College:

Students are given a context and a dotplot and are asked a number of questions regarding shape, center, and spread of the data.

Type: Problem-Solving Task

Puppy Weights:

Using the information provided, create an appropriate graphical display and answer the questions regarding shape, center and variability.

Type: Problem-Solving Task

Tutorial

Shapes of Distributions:

In this video, you will practice describing the shape of distributions as skewed left, skewed right, or symmetrical.

Type: Tutorial

Virtual Manipulative

Histogram Tool:

This virtual manipulative histogram tool can aid in analyzing the distribution of a dataset. It has 6 preset datasets and a function to add your own data for analysis.

Type: Virtual Manipulative

Parent Resources

Vetted resources caregivers can use to help students learn the concepts and skills in this benchmark.

Problem-Solving Tasks

Electoral College:

Students are given a context and a dotplot and are asked a number of questions regarding shape, center, and spread of the data.

Type: Problem-Solving Task

Puppy Weights:

Using the information provided, create an appropriate graphical display and answer the questions regarding shape, center and variability.

Type: Problem-Solving Task