
General Information
Test Item Specifications
Students will read and interpret data displayed in histograms, stem-and-leaf plots, and circle graphs.
Students will determine the correct type of graph to use to display a set of data.
Items may provide or include calculating measures of central tendency and variability for the data displayed in histograms, stem- and-leaf plots, and circle graphs only.
The number of data pieces displayed should not exceed ten when a measure of central tendency is being calculated.
The number of data pieces displayed should not exceed 25 when a measure of central tendency is not being calculated.
Percents used in items assessing circle graphs will be limited to whole-number percents.
Items should be set in a real-world context.
Graphics should be used in all items.
Gridded-response items will not include estimation of information from a histogram, stem-and-leaf plot, or circle graph.
Sample Test Items (2)
| Test Item # | Question | Difficulty | Type |
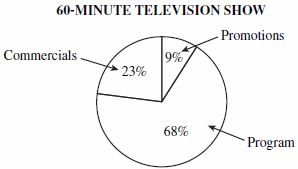
| Sample Item 1 | Television programs are separated into parts by commercials and network promotions. The circle graph below shows the percent of a 60-minute television show that is used for commercials, promotions, and the program itself.
Which is closest to the number of minutes used for commercials and promotions during that 60-minute television show? |
N/A | MC: Multiple Choice |
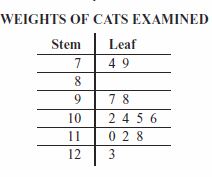
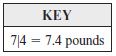
| Sample Item 2 | Dr. Neal is a veterinarian. In one day, he examined 12 cats. He recorded the weights, in pounds, of the cats in the stem-and-leaf plot below.
Based on the information in the stem-and-leaf plot, how many cats did Dr. Neal examine that weighed more than 10 pounds? |
N/A | GR: Gridded-Response |
Related Resources
Lesson Plan
| Name | Description |
| Best School for Kevin | In this MEA, the students will compare data to decide which school would be the best for a couple's son who is transferring into the county. Model Eliciting Activities, MEAs, are open-ended, interdisciplinary problem-solving activities that are meant to reveal students’ thinking about the concepts embedded in realistic situations. Click here to learn more about MEAs and how they can transform your classroom. |
Virtual Manipulatives
| Name | Description |
| Histogram Tool | This virtual manipulative histogram tool can aid in analyzing the distribution of a dataset. It has 6 preset datasets and a function to add your own data for analysis. |
| KidsZone: Create a Graph | Create bar, line, pie, area, and xy graphs. |
Student Resources
Virtual Manipulative
| Name | Description |
| Histogram Tool: | This virtual manipulative histogram tool can aid in analyzing the distribution of a dataset. It has 6 preset datasets and a function to add your own data for analysis. |