Sample Test Item Preview


This document was generated on CPALMS - www.cpalms.org


General Information

Related Standards: MAFS.912.S-ID.2.6
Reporting Category: Statistics & Probability: Interpreting Categorical & Quantitative Data
Type: OR: Open Response
Difficulty: N/A
Question:

A company creates the equation y = 11.26x-76.1 to model the relationship between the number of pages in its catalog and the number of orders, in thousands, that were received. 

To determine how well the equation models the relationship, the company plots the residuals as shown.

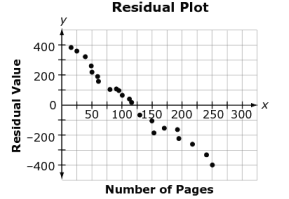
Why is the equation not a good model for the relationship?

Type your answer in the space provided.

Possible Answer:

Because the points on the residual plot have a linear pattern.


Aligned Standards

Code Description
MAFS.912.S-ID.2.6: Represent data on two quantitative variables on a scatter plot, and describe how the variables are related.
  1. Fit a function to the data; use functions fitted to data to solve problems in the context of the data. Use given functions or choose a function suggested by the context. Emphasize linear, and exponential models.
  2. Informally assess the fit of a function by plotting and analyzing residuals.
  3. Fit a linear function for a scatter plot that suggests a linear association.


Printed On:4/18/2024 3:42:41 PM
Print Page | Close this window