
Clarifications:
Essential Understandings
Concrete:
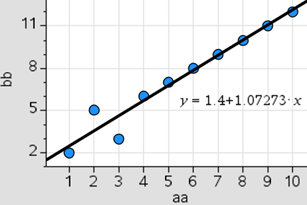
- Draw or point to a line that goes through as many points on a scatter plot or divides the data in half (i.e., use a transparency to place a line over the data in a scatter plot or a strand of spaghetti or a pipe cleaner to represent the line of best fit – a picture of a simple scatterplot with variables and a line of linear fit [line of best fit]).
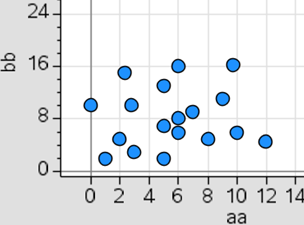
- Determine if the line goes through many points. If not the graph is not linear.
- Identify the relationship (fit) between the data and the function (e.g., linear, non-linear).
- Non-linear:
- Linear:
- MathPlanet: Click Here
| Number: MAFS.912.S-ID.2.AP.6c | Category: Access Points |
| Date Adopted or Revised: 07/14 |
Cluster:
Summarize, represent, and interpret data on two categorical and quantitative variables. (Algebra 1 - Supporting Cluster) (Algebra 2 - Supporting Cluster) : Clusters should not be sorted from Major to Supporting and then taught in that order. To do so would strip the coherence of the mathematical ideas and miss the opportunity to enhance the major work of the grade with the supporting clusters. |