
Clarifications:
Essential Understandings
Concrete:
- Arrange all data points from lowest to highest.
- Calculate the median (middle number) of the data set. (The median can also be called Q2).
- Calculate the lower quartile (Q1). This is the halfway point of the points in the data set below the median. If there are an even number of values below the median, average the two middle values to find Q1.
- Calculate the upper quartile (Q3). This is the halfway point of the points in the data set above the median. If there are an even number of values below the median, average the two middle values to find Q3.
- Find the interquartile range (IQR).
- IQR = Q3 – Q1
- Calculate: 1.5 X IQR
- Calculate the lower bound for the outliers
- Q1- 1.5 X IQR (Any data value lower than the lower bound is considered an outlier.)
- Calculate the upper bound for the outliers
- Q3+ 1.5 X IQR (Any data value higher than the upper bound is considered an outlier.)
- YouTube: Click Here
- CalculatorSoup: Click Here
- Understand the vocabulary: data points, median, mode, mean, outliers, quartile, box plot, 5 number summary, maximum, minimum, lower bound, upper bound.
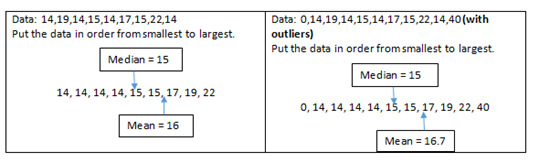
- Understand that an outlier affects the mean but not the mode or median. For example: When zero is added to the given data set (see figure below) the mean changes but the median does not.
- YouTube: Click Here
| Number: MAFS.912.S-ID.1.AP.2c | Category: Access Points |
| Date Adopted or Revised: 07/14 |
Cluster:
Summarize, represent, and interpret data on a single count or measurement variable. (Algebra 1 - Additional Cluster) (Algebra 2 - Additional Cluster) : Clusters should not be sorted from Major to Supporting and then taught in that order. To do so would strip the coherence of the mathematical ideas and miss the opportunity to enhance the major work of the grade with the supporting clusters. |