
General Information
Test Item Specifications
Students will use proportionality to demonstrate understanding of the concept of slope as a rate of change.
Students will analyze the graph of a line and find the rate of change.
Students will identify a graphic representation of a proportional relationship.
Students will explain how a change in one variable affects the other variable or how a change in the slope of the line affects one of the variables.
Students should NOT be expected to use y mx + b or the slope formula in order to solve items in this benchmark.
Items will NOT include determining the slope using formulas.
For graphs showing a line of a proportional relationship, the line must pass through the origin.
Graphs should use dashed lines for discrete values.
Items may include up to two variables, with no more than five procedural steps needed to evaluate the expression, equation, or inequality.
Items may include the use of whole numbers, fractions, and terminating decimals as indicated in the general content limits.
Items may include all four quadrants on a coordinate grid.
Items may include the concept of positive slope, negative slope, no slope, or zero slope.
Items should be set in a real-world or mathematical context.
Graphics should be used in some of these items, as appropriate.
Sample Test Items (1)
| Test Item # | Question | Difficulty | Type |
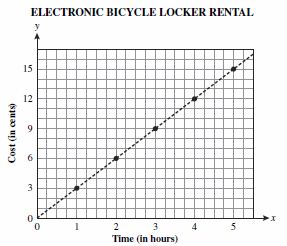
| Sample Item 1 | Electronic bicycle lockers are public storage lockers designed specifically for the storage of bicycles in a transit station. These lockers can be rented for an annual fee. The graph below shows the cost of renting an electronic bicycle locker with the annual fee changed to an hourly rate.
Which of the following shows the rate for renting an electronic bicycle locker? |
N/A | MC: Multiple Choice |
Related Resources
Educational Software / Tool
| Name | Description |
| Free Graph Paper | A variety of graph paper types for printing, including Cartesian, polar, engineering, isometric, logarithmic, hexagonal, probability, and Smith chart. |
Lesson Plan
| Name | Description |
| Scientific calculations from a distant planet | Students will act as mathematicians and scientists as they use models, observations and space science concepts to perform calculations and draw inferences regarding a fictional solar system with three planets in circular orbits around a sun. Among the calculations are estimates of the size of the home planet (using a method more than 2000 years old) and the relative distances of the planets from their sun. |
Virtual Manipulative
| Name | Description |
| Curve Fitting | With a mouse, students will drag data points (with their error bars) and watch the best-fit polynomial curve form instantly. Students can choose the type of fit: linear, quadratic, cubic, or quartic. Best fit or adjustable fit can be displayed. |
Student Resources
Virtual Manipulative
| Name | Description |
| Curve Fitting: | With a mouse, students will drag data points (with their error bars) and watch the best-fit polynomial curve form instantly. Students can choose the type of fit: linear, quadratic, cubic, or quartic. Best fit or adjustable fit can be displayed. |