
General Information
Subject Area: X-Mathematics (former standards - 2008)
Grade: 5
Body of Knowledge: Statistics
Idea: Level 2: Basic Application of Skills & Concepts
Supporting Idea: Data Analysis - Data Analysis
Date Adopted or Revised: 09/07
Content Complexity Rating:
Level 2: Basic Application of Skills & Concepts
-
More Information
Date of Last Rating: 06/07
Status: State Board Approved - Archived
Assessed: Yes
Test Item Specifications
Item Type(s):
This benchmark may be assessed using:
MC
item(s)
Also assesses MA.5.A.4.2 Construct and describe a graph showing continuous data, such as a graph of a quantity that changes over time.
Clarification :
Students will identify the appropriate graph to represent a set of continuous or discrete data.
Students will identify a set of discrete or continuous data.
Students will identify reasons why a set of data is discrete or continuous.
Content Limits :
Items may include only the first quadrant in a graph.
Items may include the terms continuous and discrete.
Items may include frequency tables, single bar graphs, double bar graphs, pictographs, line plots, line graphs, and/or Venn diagrams.
Items may include only the first quadrant in a graph.
Items may include the terms continuous and discrete.
Items may include frequency tables, single bar graphs, double bar graphs, pictographs, line plots, line graphs, and/or Venn diagrams.
Stimulus Attributes :
Graphics must be used in all these items.
Graphics must be used in all these items.
Response Attributes :
Options may include graphic displays of a set of data.
Items will not include data that results in negative values.
Options may include graphic displays of a set of data.
Items will not include data that results in negative values.
Sample Test Items (1)
| Test Item # | Question | Difficulty | Type |
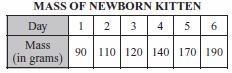
| Sample Item 1 | A veterinarian measured the mass of a newborn kitten each day for 6 days. The results are shown in the table below.
Which graph is the best representation of the data in the table? |
N/A | MC: Multiple Choice |
Related Resources
Educational Software / Tool
| Name | Description |
| Free Graph Paper | A variety of graph paper types for printing, including Cartesian, polar, engineering, isometric, logarithmic, hexagonal, probability, and Smith chart. |