
General Information
Test Item Specifications
Students will identify line graphs or double bar graphs to represent a given set of data.
Students will interpret, analyze, and compare data represented on line graphs or double bar graphs.
Students will identify, interpret, or describe a graph that shows a quantity that changes over time.
Items may require students to predict if the line graph represents data that are increasing or decreasing. (Students at Grade 5 are NOT expected to use the word trend.)
Analysis may include making and stating conclusions and predictions based on data, comparing data, determining appropriate scale increments dependent upon the range of the data, or identifying different parts of a graph.
Items should not require students to determine the type of graph to use.
Items should contain no more than 20 items of raw data that must be categorized or displayed.
Students may be expected to perform addition, subtraction, multiplication, or division when identifying and/or analyzing graphs.
Items should be set in a real-world context.
Graphics will be used in all these items.
Sample Test Items (1)
| Test Item # | Question | Difficulty | Type |
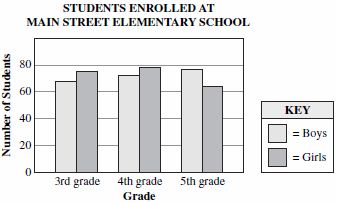
| Sample Item 1 | The graph below shows the number of boys and girls enrolled in three grades at Main Street Elementary School.
Based on the graph, which of the following statements is true about the enrollment at Main Street Elementary School? |
N/A | MC: Multiple Choice |
Related Resources
Virtual Manipulatives
| Name | Description |
| KidsZone: Create a Graph | Create bar, line, pie, area, and xy graphs. |
| Multi Bar Graph | This activity allows the user to graph data sets in multiple bar graphs. The color, thickness, and scale of the graph are adjustable which may produce graphs that are misleading. Users may input their own data, or use or alter pre-made data sets. This activity includes supplemental materials, including background information about the topics covered, a description of how to use the application, and exploration questions for use with the java applet. |
Student Resources
Virtual Manipulative
| Name | Description |
| Multi Bar Graph: | This activity allows the user to graph data sets in multiple bar graphs. The color, thickness, and scale of the graph are adjustable which may produce graphs that are misleading. Users may input their own data, or use or alter pre-made data sets. This activity includes supplemental materials, including background information about the topics covered, a description of how to use the application, and exploration questions for use with the java applet. |