
General Information
Clusters should not be sorted from Major to Supporting and then taught in that order. To do so would strip the coherence of the mathematical ideas and miss the opportunity to enhance the major work of the grade with the supporting clusters.
Test Item Specifications
- Use spark timers to collect displacement and time data.
- Use this data to calculate the average velocity for the object during each interval.
- Graph this data on a velocity versus time graph, V-t. They find the slope of this graph to calculate acceleration.
- Calculate the falling object's acceleration from their data table and graph this data on an acceleration versus time graph, a-t.
- Use their Spark timer data paper, cut it into intervals, and paste these intervals into their displacement versus time graph.
- In Lesson 1 students use mathematical models (tables and equations) to represent the relationship between the number of revolutions made by a "driver" and a "follower" (two connected gears in a system), and they will explain the significance of the radii of the gears in regard to this relationship.
- In Lesson 2 students mathematically model the growth of populations and use exponential functions to represent that growth.
MAFS.912.F-LE.2.5
Exponential functions should be in the form

Neutral
Students will determine whether the real-world context may be
represented by a linear function or an exponential function and give
the constant rate or the rate of growth or decay.
Students will choose an explanation as to why a context may be
modeled by a linear function or an exponential function.
Students will interpret the rate of change and intercepts of a linear
function when given an equation that models a real-world context.
Students will interpret the x-intercept, y-intercept, and/or rate of
growth or decay of an exponential function given in a real-world
context
Items should be set in a real-world context.
Items must use function notation.
Items may require the student to apply the basic modeling cycle.
Items may require the student to choose a parameter that is
described within the real-world context.
Items may require the student to choose an appropriate level of
accuracy.
Items may require the student to choose and interpret the scale in a
graph.
Items may require the student to choose and interpret units.
Sample Test Items (1)
| Test Item # | Question | Difficulty | Type |
| Sample Item 1 | The graph of function f models the specific humidity in the atmosphere, in grams of water vapor per kilogram of atmospheric gas
This question has two parts. Part A. Felicia wants to model the raltionship between temperature, in ºC, and specific humidity, in The relationship is _____________ because the specific humidity increases by equal ______ over equal intervals of temperature. Part B. Which relationship must be true to justify the function type that models the relationship? |
N/A | : Multiple Types |
 , versus temperature, in degrees Celsius (ºC), as shown. Four of its points are labeled.
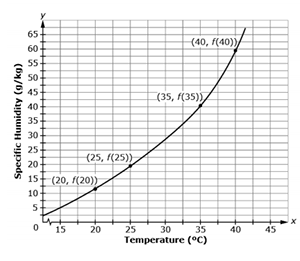
 . Select words to complete the statement about the type of model Felicia should use.
Related Courses
Related Resources
Formative Assessments
| Name | Description |
| How Does Your Garden Grow? | Students are given a linear and an exponential function, one represented verbally and the other by a table. Then students are asked to compare the rate of change in each in the context of the problem. |
| Exponential Growth | Students are given two functions, one represented verbally and the other by a table, and are asked to compare the rate of change in each in the context of the problem. |
| Prove Linear | Students are asked to prove that a linear function grows by equal differences over equal intervals. |
| Prove Exponential | Students are asked to prove that an exponential function grows by equal factors over equal intervals. |
| Linear or Exponential? | Students are given four verbal descriptions of functions and asked to identify each as either linear or exponential and to justify their choices. |
Lesson Plans
| Name | Description |
| The Towers of Hanoi: Experiential Recursive Thinking |
|
| You’re Pulling My Leg – or Candy! | Students will explore how exponential growth and decay equations can model real-world problems. Students will also discover how manipulating the variables in an exponential equation changes the graph. Students will watch a Perspectives Video to see how exponential growth is modeled in the real world. |
| Modeling: Having Kittens | This lesson unit is intended to help you assess how well students are able to interpret a situation and represent the constraints and variables mathematically, select appropriate mathematical methods to use, make sensible estimates and assumptions, investigate an exponentially increasing sequence and communicate their reasoning clearly. |
| Functions and Everyday Situations | This lesson unit is intended to help you assess how well students are able to articulate verbally the relationships between variables arising in everyday contexts, translate between everyday situations and sketch graphs of relationships between variables, interpret algebraic functions in terms of the contexts in which they arise and reflect on the domains of everyday functions and in particular whether they should be discrete or continuous. |
| Appreciation for Car Depreciation | Students will use information from the internet or a car dealership's advertisement to identify a car and determine the future value of the car using different depreciation rates over different intervals of time. Students will graph their data to show exponential decay and compare to a linear decrease on the same graph. |
| BIOSCOPES Summer Institute 2013 - Motion | This lesson is the first in a sequence of grade 9-12 physical science lessons that are organized around the big ideas that frame motion, forces, and energy. It directly precedes resource # 52648 "BIOSCOPES Summer Institute 2013 - Forces." This lesson is designed along the lines of an iterative 5-E learning cycle and employs a predict, observe, and explain (POE) activity at the beginning of the "Engage" phase in order to elicit student prior knowledge. The POE is followed by a sequence of inquiry-based activities and class discussions that are geared toward leading the students systematically through the exploration of 1-dimensional motion concepts. Included in this resource is a summative assessment as well as a teacher guide for each activity. |
| Falling for Gravity | Students will investigate the motion of three objects of different masses undergoing free fall. Additionally, students will: |
| Which Function? | This activity has students apply their knowledge to distinguish between numerical data that can be modeled in linear or exponential forms. Students will create mathematical models (graph, equation) that represent the data and compare these models in terms of the information they show and their limitations. Students will use the models to compute additional information to predict future outcomes and make conjectures based on these predictions. |
| Piles of Paper | Piles of Paper is a student activity that demonstrates linear and exponential growth using heights of flat and folded paper. Data tables are created and then algebraic models are developed. Real world types of linear and exponential growth are also introduced. |
Original Student Tutorial
| Name | Description |
| Exponential Functions Part 2: Growth | Learn about exponential growth in the context of interest earned as money is put in a savings account by examining equations, graphs, and tables in this interactive tutorial. |
Perspectives Video: Expert
| Name | Description |
| Tree Rings Research to Inform Land Management Practices | <p>In this video, fire ecologist Monica Rother describes tree ring research and applications for land management.</p> |
Perspectives Video: Professional/Enthusiasts
Problem-Solving Tasks
| Name | Description |
| Algae Blooms | In this example, students are asked to write a function describing the population growth of algae. It is implied that this is exponential growth. |
| What functions do two graph points determine? | This problem solving task challenges students to find the linear, exponential and quadratic functions based on two points. |
| US Population 1982-1988 | This problem solving task asks students to predict and model US population based on a chart of US population data from 1982 to 1988. |
| US Population 1790-1860 | This problem solving task asks students to solve five exponential and linear function problems based on a US population chart for the years 1790-1860. |
| Rising Gas Prices - Compounding and Inflation | The purpose of this task is to give students an opportunity to explore various aspects of exponential models (e.g., distinguishing between constant absolute growth and constant relative growth, solving equations using logarithms, applying compound interest formulas) in the context of a real world problem with ties to developing financial literacy skills. In particular, students are introduced to the idea of inflation of prices of a single commodity, and are given a very brief introduction to the notion of the Consumer Price Index for measuring inflation of a body of goods. |
| Linear or exponential? | This task gives a variation of real-life contexts which could be modeled by a linear or exponential function. The key distinguishing feature between the two is whether the change by equal factors over equal intervals (exponential functions), or by a constant increase per unit interval (linear functions). The task could either be used as an assessment problem on this distinction, or used as an introduction to the differences between these very important classes of functions. |
| Linear Functions | This task requires students to use the fact that on the graph of the linear function h(x) = ax + b, the y-coordinate increases by a when x increases by one. Specific values for a and b were left out intentionally to encourage students to use the above fact as opposed to computing the point of intersection, (p,q), and then computing respective function values to answer the question. |
| Comparing Exponentials | This task gives students an opportunity to work with exponential functions in a real world context involving continuously compounded interest. They will study how the base of the exponential function impacts its growth rate and use logarithms to solve exponential equations. |
| Carbon 14 Dating, Variation 2 | This exploratory task requires the student to use properties of exponential functions in order to estimate how much Carbon 14 remains in a preserved plant after different amounts of time. |
| Basketball Rebounds | This task involves a fairly straightforward decaying exponential. Filling out the table and developing the general formula is complicated only by the need to work with a fraction that requires decisions about rounding and precision. |
| Basketball Bounces, Assessment Variation 2 | This task asks students to analyze data from a physical context, choose a model that reasonably fits the data, and use the model to answer questions about the physical context. This variant of the task is not scaffolded; for a more scaffolded version, see Basketball Bounces, Assessment Variation 1. |
| Basketball Bounces, Assessment Variation 1 | Students are asked to select the best model for a given context and use the model to make predictions. This task assesses students’ modeling skills. Students are tasked to distinguish between situations that can be modeled with linear and exponential functions and recognize situations in which a quantity grows or decays by a constant percent rate per unit interval relative to another. |
| Exponential Functions | This task requires students to use the fact that the value of an exponential function f(x) = a · b^x increases by a multiplicative factor of b when x increases by one. It intentionally omits specific values for c and d in order to encourage students to use this fact instead of computing the point of intersection, (p,q), and then computing function values to answer the question. |
| Equal Factors over Equal Intervals | This problem assumes that students are familiar with the notation x0 and ?x. However, the language "successive quotient" may be new. |
| Equal Differences over Equal Intervals 2 | This task assumes that students are familiar with the ?x and ?y notations. Students most likely developed this familiarity in their work with slope. |
| Equal Differences over Equal Intervals 1 | An important property of linear functions is that they grow by equal differences over equal intervals. In F.LE Equal Differences over Equal Intervals 1, students prove this for equal intervals of length one unit, and note that in this case the equal differences have the same value as the slope. |
| In the Billions and Linear Modeling | This problem-solving task asks students to examine if linear modeling would be appropriate to describe and predict population growth from select years. |
| In the Billions and Exponential Modeling | This problem-solving task provides students an opportunity to experiment with modeling real data by using population growth rates from the past two centuries. |
| Interesting Interest Rates | This problem-solving task challenges students to write expressions and create a table to calculate how much money can be gained after investing at different banks with different interest rates. |
| Illegal Fish | This problem-solving task asks students to describe exponential growth through a real-world problem involving the illegal introduction of fish into a lake. |
| Identifying Functions | This problem-solving emphasizes the expectation that students know linear functions grow by constant differences over equal intervals and exponential functions grow by constant factors over equal intervals. |
Professional Development
| Name | Description |
| Mathematical Modeling: Insights into Algebra, Teaching for Learning | This professional development resource provides a rich collection of information to help teachers engage students more effectively in mathematical modeling. It features videos of two complete lessons with commentary, background information on effective teaching, modeling, and lesson study, full lesson plans to teach both example lessons, examples of student work from the lessons, tips for effective teaching strategies, and list of helpful resources. |
Unit/Lesson Sequence
| Name | Description |
| Sample Algebra 1 Curriculum Plan Using CMAP | This sample Algebra 1 CMAP is a fully customizable resource and curriculum-planning tool that provides a framework for the Algebra 1 Course. The units and standards are customizable and the CMAP allows instructors to add lessons, worksheets, and other resources as needed. This CMAP also includes rows that automatically filter and display Math Formative Assessments System tasks, E-Learning Original Student Tutorials and Perspectives Videos that are aligned to the standards, available on CPALMS. Learn more about the sample Algebra 1 CMAP, its features and customizability by watching the following video: Using this CMAPTo view an introduction on the CMAP tool, please . To view the CMAP, click on the "Open Resource Page" button above; be sure you are logged in to your iCPALMS account. To use this CMAP, click on the "Clone" button once the CMAP opens in the "Open Resource Page." Once the CMAP is cloned, you will be able to see it as a class inside your iCPALMS My Planner (CMAPs) app. To access your My Planner App and the cloned CMAP, click on the iCPALMS tab in the top menu. All CMAP tutorials can be found within the iCPALMS Planner App or at the following URL: http://www.cpalms.org/support/tutorials_and_informational_videos.aspx |
Video/Audio/Animation
| Name | Description |
| MIT BLOSSOMS - Flu Math Games | This video lesson shows students that math can play a role in understanding how an infectious disease spreads and how it can be controlled. During this lesson, students will see and use both deterministic and probabilistic models and will learn by doing through role-playing exercises. There are no formal prerequisites, as students in any high school or even middle school math class could enjoy this learning video. But more advanced classes can go into the optional applied probability modeling that accompanies the module in a downloadable pdf file. The primary exercises between video segments of this lesson are class-intensive simulation games in which members of the class 'infect' each other under alternative math modeling assumptions about disease progression. Also there is an occasional class discussion and local discussion with nearby classmates. |
Virtual Manipulatives
| Name | Description |
| Functions and Vertical Line Test | This lesson is designed to introduce students to the vertical line test for functions as well as practice plotting points and drawing simple functions. The lesson provides links to discussions and activities related to the vertical line test and functions as well as suggested ways to integrate them into the lesson. |
| Data Flyer | Using this virtual manipulative, students are able to graph a function and a set of ordered pairs on the same coordinate plane. The constants, coefficients, and exponents can be adjusted using slider bars, so the student can explore the affect on the graph as the function parameters are changed. Students can also examine the deviation of the data from the function. This activity includes supplemental materials, including background information about the topics covered, a description of how to use the application, and exploration questions for use with the java applet. |
| Function Flyer | In this online tool, students input a function to create a graph where the constants, coefficients, and exponents can be adjusted by slider bars. This tool allows students to explore graphs of functions and how adjusting the numbers in the function affect the graph. Using tabs at the top of the page you can also access supplemental materials, including background information about the topics covered, a description of how to use the application, and exploration questions for use with the java applet. |
Student Resources
Original Student Tutorial
| Name | Description |
| Exponential Functions Part 2: Growth: | Learn about exponential growth in the context of interest earned as money is put in a savings account by examining equations, graphs, and tables in this interactive tutorial. |
Problem-Solving Tasks
| Name | Description |
| Algae Blooms: | In this example, students are asked to write a function describing the population growth of algae. It is implied that this is exponential growth. |
| What functions do two graph points determine?: | This problem solving task challenges students to find the linear, exponential and quadratic functions based on two points. |
| US Population 1982-1988: | This problem solving task asks students to predict and model US population based on a chart of US population data from 1982 to 1988. |
| US Population 1790-1860: | This problem solving task asks students to solve five exponential and linear function problems based on a US population chart for the years 1790-1860. |
| Rising Gas Prices - Compounding and Inflation: | The purpose of this task is to give students an opportunity to explore various aspects of exponential models (e.g., distinguishing between constant absolute growth and constant relative growth, solving equations using logarithms, applying compound interest formulas) in the context of a real world problem with ties to developing financial literacy skills. In particular, students are introduced to the idea of inflation of prices of a single commodity, and are given a very brief introduction to the notion of the Consumer Price Index for measuring inflation of a body of goods. |
| Linear or exponential?: | This task gives a variation of real-life contexts which could be modeled by a linear or exponential function. The key distinguishing feature between the two is whether the change by equal factors over equal intervals (exponential functions), or by a constant increase per unit interval (linear functions). The task could either be used as an assessment problem on this distinction, or used as an introduction to the differences between these very important classes of functions. |
| Linear Functions: | This task requires students to use the fact that on the graph of the linear function h(x) = ax + b, the y-coordinate increases by a when x increases by one. Specific values for a and b were left out intentionally to encourage students to use the above fact as opposed to computing the point of intersection, (p,q), and then computing respective function values to answer the question. |
| Comparing Exponentials: | This task gives students an opportunity to work with exponential functions in a real world context involving continuously compounded interest. They will study how the base of the exponential function impacts its growth rate and use logarithms to solve exponential equations. |
| Carbon 14 Dating, Variation 2: | This exploratory task requires the student to use properties of exponential functions in order to estimate how much Carbon 14 remains in a preserved plant after different amounts of time. |
| Basketball Rebounds: | This task involves a fairly straightforward decaying exponential. Filling out the table and developing the general formula is complicated only by the need to work with a fraction that requires decisions about rounding and precision. |
| Exponential Functions: | This task requires students to use the fact that the value of an exponential function f(x) = a · b^x increases by a multiplicative factor of b when x increases by one. It intentionally omits specific values for c and d in order to encourage students to use this fact instead of computing the point of intersection, (p,q), and then computing function values to answer the question. |
| Equal Factors over Equal Intervals: | This problem assumes that students are familiar with the notation x0 and ?x. However, the language "successive quotient" may be new. |
| Equal Differences over Equal Intervals 2: | This task assumes that students are familiar with the ?x and ?y notations. Students most likely developed this familiarity in their work with slope. |
| Equal Differences over Equal Intervals 1: | An important property of linear functions is that they grow by equal differences over equal intervals. In F.LE Equal Differences over Equal Intervals 1, students prove this for equal intervals of length one unit, and note that in this case the equal differences have the same value as the slope. |
| In the Billions and Linear Modeling: | This problem-solving task asks students to examine if linear modeling would be appropriate to describe and predict population growth from select years. |
| In the Billions and Exponential Modeling: | This problem-solving task provides students an opportunity to experiment with modeling real data by using population growth rates from the past two centuries. |
| Interesting Interest Rates: | This problem-solving task challenges students to write expressions and create a table to calculate how much money can be gained after investing at different banks with different interest rates. |
| Illegal Fish: | This problem-solving task asks students to describe exponential growth through a real-world problem involving the illegal introduction of fish into a lake. |
| Identifying Functions: | This problem-solving emphasizes the expectation that students know linear functions grow by constant differences over equal intervals and exponential functions grow by constant factors over equal intervals. |
Virtual Manipulatives
| Name | Description |
| Data Flyer: | Using this virtual manipulative, students are able to graph a function and a set of ordered pairs on the same coordinate plane. The constants, coefficients, and exponents can be adjusted using slider bars, so the student can explore the affect on the graph as the function parameters are changed. Students can also examine the deviation of the data from the function. This activity includes supplemental materials, including background information about the topics covered, a description of how to use the application, and exploration questions for use with the java applet. |
| Function Flyer: | In this online tool, students input a function to create a graph where the constants, coefficients, and exponents can be adjusted by slider bars. This tool allows students to explore graphs of functions and how adjusting the numbers in the function affect the graph. Using tabs at the top of the page you can also access supplemental materials, including background information about the topics covered, a description of how to use the application, and exploration questions for use with the java applet. |
Parent Resources
Problem-Solving Tasks
| Name | Description |
| Algae Blooms: | In this example, students are asked to write a function describing the population growth of algae. It is implied that this is exponential growth. |
| What functions do two graph points determine?: | This problem solving task challenges students to find the linear, exponential and quadratic functions based on two points. |
| US Population 1982-1988: | This problem solving task asks students to predict and model US population based on a chart of US population data from 1982 to 1988. |
| US Population 1790-1860: | This problem solving task asks students to solve five exponential and linear function problems based on a US population chart for the years 1790-1860. |
| Rising Gas Prices - Compounding and Inflation: | The purpose of this task is to give students an opportunity to explore various aspects of exponential models (e.g., distinguishing between constant absolute growth and constant relative growth, solving equations using logarithms, applying compound interest formulas) in the context of a real world problem with ties to developing financial literacy skills. In particular, students are introduced to the idea of inflation of prices of a single commodity, and are given a very brief introduction to the notion of the Consumer Price Index for measuring inflation of a body of goods. |
| Linear or exponential?: | This task gives a variation of real-life contexts which could be modeled by a linear or exponential function. The key distinguishing feature between the two is whether the change by equal factors over equal intervals (exponential functions), or by a constant increase per unit interval (linear functions). The task could either be used as an assessment problem on this distinction, or used as an introduction to the differences between these very important classes of functions. |
| Linear Functions: | This task requires students to use the fact that on the graph of the linear function h(x) = ax + b, the y-coordinate increases by a when x increases by one. Specific values for a and b were left out intentionally to encourage students to use the above fact as opposed to computing the point of intersection, (p,q), and then computing respective function values to answer the question. |
| Comparing Exponentials: | This task gives students an opportunity to work with exponential functions in a real world context involving continuously compounded interest. They will study how the base of the exponential function impacts its growth rate and use logarithms to solve exponential equations. |
| Carbon 14 Dating, Variation 2: | This exploratory task requires the student to use properties of exponential functions in order to estimate how much Carbon 14 remains in a preserved plant after different amounts of time. |
| Basketball Rebounds: | This task involves a fairly straightforward decaying exponential. Filling out the table and developing the general formula is complicated only by the need to work with a fraction that requires decisions about rounding and precision. |
| Exponential Functions: | This task requires students to use the fact that the value of an exponential function f(x) = a · b^x increases by a multiplicative factor of b when x increases by one. It intentionally omits specific values for c and d in order to encourage students to use this fact instead of computing the point of intersection, (p,q), and then computing function values to answer the question. |
| Equal Factors over Equal Intervals: | This problem assumes that students are familiar with the notation x0 and ?x. However, the language "successive quotient" may be new. |
| Equal Differences over Equal Intervals 2: | This task assumes that students are familiar with the ?x and ?y notations. Students most likely developed this familiarity in their work with slope. |
| Equal Differences over Equal Intervals 1: | An important property of linear functions is that they grow by equal differences over equal intervals. In F.LE Equal Differences over Equal Intervals 1, students prove this for equal intervals of length one unit, and note that in this case the equal differences have the same value as the slope. |
| In the Billions and Linear Modeling: | This problem-solving task asks students to examine if linear modeling would be appropriate to describe and predict population growth from select years. |
| In the Billions and Exponential Modeling: | This problem-solving task provides students an opportunity to experiment with modeling real data by using population growth rates from the past two centuries. |
| Interesting Interest Rates: | This problem-solving task challenges students to write expressions and create a table to calculate how much money can be gained after investing at different banks with different interest rates. |
| Illegal Fish: | This problem-solving task asks students to describe exponential growth through a real-world problem involving the illegal introduction of fish into a lake. |
| Identifying Functions: | This problem-solving emphasizes the expectation that students know linear functions grow by constant differences over equal intervals and exponential functions grow by constant factors over equal intervals. |