
General Information
Clusters should not be sorted from Major to Supporting and then taught in that order. To do so would strip the coherence of the mathematical ideas and miss the opportunity to enhance the major work of the grade with the supporting clusters.
Test Item Specifications
- Interpret distance-time graphs as if they are pictures of situations rather than abstract representations of them.
- Have difficulty relating speeds to slopes of these graphs.
Function notation may not be used. Functions must be linear.
Yes
Allowable
Sample Test Items (2)
| Test Item # | Question | Difficulty | Type |
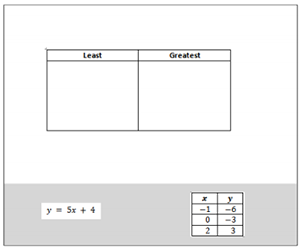
| Sample Item 1 | Drag each function to the box to show the least rate and the greatest rate.
|
N/A | GRID: Graphic Response Item Display |
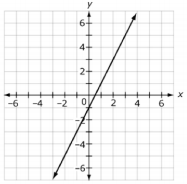
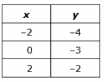
| Sample Item 2 | Two linear functions are shown. Function 1:
Function 2:
Create an equation for a third function that has a greater rate of change than one function but a smaller rate of change than the other function. |
N/A | EE: Equation Editor |
Related Courses
| Course Number1111 | Course Title222 |
| 1205050: | M/J Accelerated Mathematics Grade 7 (Specifically in versions: 2014 - 2015, 2015 - 2020, 2020 - 2022, 2022 - 2024, 2024 and beyond (current)) |
| 1205070: | M/J Grade 8 Pre-Algebra (Specifically in versions: 2014 - 2015, 2015 - 2022, 2022 - 2024, 2024 and beyond (current)) |
| 1204000: | M/J Foundational Skills in Mathematics 6-8 (Specifically in versions: 2014 - 2015, 2015 - 2022, 2022 - 2024, 2024 and beyond (current)) |
| 7812030: | Access M/J Grade 8 Pre-Algebra (Specifically in versions: 2014 - 2015, 2015 - 2018, 2018 - 2019, 2019 - 2022, 2022 and beyond (current)) |
Related Resources
Formative Assessments
| Name | Description |
| Interpreting Distance-Time Graphs | This lesson unit is intended to help you assess how well students are able to interpret distance-time graphs and, in particular, to help you identify students who:
|
| Innovative Functions | Students are asked to determine the rates of change of two functions presented in different forms (an expression and a table) and determine which is the greater rate of change within a real-world context. |
| Competing Functions | Students are asked to determine and interpret the initial values of two functions represented in different ways (equation and graph), and compare them. |
| Speed Reading | Students are asked to determine the rate of change of two functions presented in different forms (table and graph) and determine which is the greater rate of change within a real-world context. |
| This House Is Mine! | Students are asked to determine a specific value of two functions given in different forms (a graph and a verbal description) within a real-world context, and compare them. |
Lesson Plans
| Name | Description |
| Lines and Linear Equations | This lesson unit is intended to help you assess how well students are able to interpret speed as the slope of a linear graph and translate between the equation of a line and its graphical representation. |
| The Linear Function Connection | The students will compare two linear functions that have been represented in different ways (equation, table, graph, verbal description). They will be able to find and compare the rate of change, or slope, of the function from any of the representations. |
| How Much is My Cell Phone Plan? | In this lesson, shopping for cell phone plans provides a motivating context where students will compare and interpret the properties of two functions represented in different ways. The lesson starts with students examining and discussing an input/output table to identify rate of change and y-intercept. Students will each be assigned a group. Groups will solve two different problems involving cell phone plans. They must determine the rate of change, y-intercept, and the total cost after two years. Students will receive homework and have a summative assessment the next day. |
Original Student Tutorial
| Name | Description |
| Functions, Sweet Functions | See how sweet it can be to determine the slope of linear functions and compare them in this interactive tutorial. Determine and compare the slopes or the rates of change by using verbal descriptions, tables of values, equations and graphical forms. |
Problem-Solving Task
| Name | Description |
| Battery Charging | This task has students engaging in a simple modeling exercise, taking verbal and numerical descriptions of battery life as a function of time and writing down linear models for these quantities. To draw conclusions about the quantities, students have to find a common way of describing them. |
Student Center Activity
| Name | Description |
| Edcite: Mathematics Grade 8 | Students can practice answering mathematics questions on a variety of topics. With an account, students can save their work and send it to their teacher when complete. |
Unit/Lesson Sequence
| Name | Description |
| Linear Functions and Slope | This session on linear function and slope contains five parts, multiple problems and videos, and interactive activities geared to help students recognize and understand linear relationships, explore slope and dependent and independent variables in graphs of linear relationships, and develop an understanding of rates and how they are related to slopes and equations. Throughout the session, students use spreadsheets to complete the work, and are encouraged to think about the ways technology can aid in teaching and understanding. The solutions for all problems are given, and many allow students to have a hint or tip as they solve. There is even a homework assignment with four problems for students after they have finished all five parts of the session. |
Student Resources
Original Student Tutorial
| Name | Description |
| Functions, Sweet Functions: | See how sweet it can be to determine the slope of linear functions and compare them in this interactive tutorial. Determine and compare the slopes or the rates of change by using verbal descriptions, tables of values, equations and graphical forms. |
Student Center Activity
| Name | Description |
| Edcite: Mathematics Grade 8: | Students can practice answering mathematics questions on a variety of topics. With an account, students can save their work and send it to their teacher when complete. |
Parent Resources
Problem-Solving Task
| Name | Description |
| Battery Charging: | This task has students engaging in a simple modeling exercise, taking verbal and numerical descriptions of battery life as a function of time and writing down linear models for these quantities. To draw conclusions about the quantities, students have to find a common way of describing them. |