
General Information
Clusters should not be sorted from Major to Supporting and then taught in that order. To do so would strip the coherence of the mathematical ideas and miss the opportunity to enhance the major work of the grade with the supporting clusters.
Test Item Specifications
MAFS.7.SP.2.3
N/A
Neutral
Required
Sample Test Items (2)
| Test Item # | Question | Difficulty | Type |
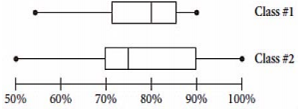
| Sample Item 1 | Box plots for chapter 6 test scores of two classes are shown.
What is the difference in the median between the two sets of data?
|
N/A | EE: Equation Editor |
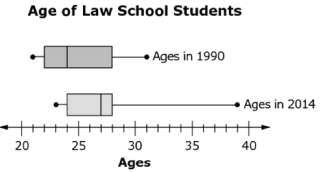
| Sample Item 2 | Survey data involving two random samples of students at a law school are shown. The surveys were taken comparing the age of students in 1990 to the age of students in 2014.
Select all the statements that are true about the two samples of students.
|
N/A | SHT: Selectable Hot Text |
Related Courses
| Course Number1111 | Course Title222 |
| 1205040: | M/J Grade 7 Mathematics (Specifically in versions: 2014 - 2015, 2015 - 2022, 2022 - 2024, 2024 and beyond (current)) |
| 1205050: | M/J Accelerated Mathematics Grade 7 (Specifically in versions: 2014 - 2015, 2015 - 2020, 2020 - 2022, 2022 - 2024, 2024 and beyond (current)) |
| 2002050: | M/J Comprehensive Science 1, Advanced (Specifically in versions: 2014 - 2015, 2015 - 2022, 2022 - 2024, 2024 and beyond (current)) |
| 2002070: | M/J Comprehensive Science 2 (Specifically in versions: 2014 - 2015, 2015 - 2022, 2022 - 2024, 2024 and beyond (current)) |
| 2002080: | M/J Comprehensive Science 2, Advanced (Specifically in versions: 2014 - 2015, 2015 - 2022, 2022 - 2024, 2024 and beyond (current)) |
| 2001020: | M/J Earth/Space Science, Advanced (Specifically in versions: 2014 - 2015, 2015 - 2022, 2022 - 2024, 2024 and beyond (current)) |
| 2000020: | M/J Life Science, Advanced (Specifically in versions: 2014 - 2015, 2015 - 2022, 2022 - 2024, 2024 and beyond (current)) |
| 2003010: | M/J Physical Science (Specifically in versions: 2014 - 2015, 2015 - 2022, 2022 - 2024, 2024 and beyond (current)) |
| 2003020: | M/J Physical Science, Advanced (Specifically in versions: 2014 - 2015, 2015 - 2022, 2022 - 2024, 2024 and beyond (current)) |
| 1204000: | M/J Foundational Skills in Mathematics 6-8 (Specifically in versions: 2014 - 2015, 2015 - 2022, 2022 - 2024, 2024 and beyond (current)) |
| 7812020: | Access M/J Grade 7 Mathematics (Specifically in versions: 2014 - 2015, 2015 - 2018, 2018 - 2019, 2019 - 2022, 2022 and beyond (current)) |
| 7820016: | Access M/J Comprehensive Science 2 (Specifically in versions: 2014 - 2015, 2015 - 2018, 2018 - 2023, 2023 and beyond (current)) |
| 2002055: | M/J Comprehensive Science 1 Accelerated Honors (Specifically in versions: 2014 - 2015, 2015 - 2022, 2022 - 2024, 2024 and beyond (current)) |
Related Resources
Formative Assessments
| Name | Description |
| Cranberry Counting | Students are asked to assess the validity of an inference regarding two distributions given their box plots. |
| Word Length | Students are asked to use the mean and the mean absolute deviation (MAD) to compare two distributions. |
| Overlapping Trees | Students are asked to compare two distributions given side-by-side box plots. |
Lesson Plans
| Name | Description |
| Data Sets Represented in Computers | This lesson shows how data can be represented by computers, in relation to everyday activities we may not be aware that we use computer. It gives an overview of graphing data by creating a histogram based on population data. Using the data collected, students will get a chance to hand write code to show what structure is needed for computers to collect, analyze and distribute such data. This lesson is lesson 1 of the Data Set and Deviation Statistics Unit and bridges statistical concepts of data collection, graphing and analysis with programming a computer using coding language while reinforcing foundational algebraic skills. |
| Sea Ice Analysis Grade 7 | The changing climate is an important topic for both scientific analysis and worldly knowledge. This lesson uses data collected by the National Snow and Ice Data Center to create and use statistical analysis as a tool to evaluate the sea ice loss. Students will use technology to quickly generate graphs for each month looking for trends, patterns, or deviations over time. |
| Sensoring Data | In this follow up lesson, students will explore data collection using the weather station sensor and perform statistical analysis of the data. Students will use a scientific method of inquiry to plan an investigation of their own. This activity is meant to allow students to use a variety of skills they have acquired throughout a statistics unit in a personally meaningful way. |
| Sensoring Data | In this follow up lesson, students will explore data collection using the weather station sensor and perform statistical analysis of the data. Students will use a scientific method of inquiry to plan an investigation of their own. This activity is meant to allow students to use a variety of skills they have acquired throughout a statistics unit in a personally meaningful way. |
| Hot Coffee Coming Through | In this lesson, students will explore data collection using the temperature probe sensor and perform statistical analysis of the data. Students will use a scientific method of inquiry to plan an investigation to determine which coffee mug is the best. This activity is meant to allow students to use a variety of skills they have acquired throughout a statistics unit in a problem based STEM challenge. Due to the multiple skills there are many standards that are covered. There are two options for this lab. The first student handout is for students at an average high school statistics level (Algebra 1) and will allow for standard deviation and graphical analyses of the data. The second option is for advanced students that have been exposed to hypothesis testing of claims (Algebra 2 or AP Stats). |
| Grapevine Fabrication Part 2 | This lesson is a Follow Up Activity to the Algebra Institute and allows students to collect data to perform basic statistical operations to analyze and make comparisons on variability within a certain brand of raisins. Part 1 must be completed prior to starting Part 2. This investigation can elicit discussion about manufacturing and quality control. |
| Bubble Gum Bubbles Lab | This lesson is a Follow Up Activity to the Algebra Institute and allows students to collect data by blowing bubble gum bubbles and perform statistical analysis, including standard deviation. This lesson provides students an applied setting to use their previously acquired statistical skills. |
| Height Arm Juxtaposition | This lesson is a Follow Up Activity to the Algebra Institute and allows students to apply their skills on analyzing bivariate data. This STEM lesson allows students the opportunity to investigate if there is a linear relationship between a person's height and arm length. Using technology the students will explore in-depth how to perform a least square regression as a procedure for determining the line of best fit. |
| Grapevine Fabrication Part 1 | This lesson is a Follow Up Activity to the Algebra Institute and allows students to collect data to perform basic statistical operations to analyze and make comparisons on variability within a certain brand of raisins. Part 1 may be completed without Part 2. This investigation can elicit discussion about manufacturing and quality control. |
| Water Troubles | This Model Eliciting Activity (MEA) presents students with the real-world problem of contaminated drinking water. Students are asked to provide recommendations for a non-profit organization working to help a small Romanian village acquire clean drinking water. They will work to develop the best temporary strategies for water treatment, including engineering the best filtering solution using local materials. Students will utilize measures of center and variation to compare data, assess proportional relationships to make decisions, and perform unit conversions across different measurement systems. |
| Brr! How Cold is the Antarctic? | In this PBL activity, students use online data to determine the extent of temperature changes in the Antarctic. They will analyze their data using measures of central tendency as well as measuring its variability. They will also use scratch to assist them in the calculations. These lesson will take two 50-minute periods. |
Perspectives Video: Professional/Enthusiasts
| Name | Description |
| Field Sampling with the Point-centered Quarter Method | In this video, Jim Cox describes a sampling method for estimating the density of dead trees in a forest ecosystem. Download the CPALMS Perspectives video student note taking guide. |
| Nestle Waters & Statistical Analysis | <p>Hydrogeologist from Nestle Waters discusses the importance of statistical tests in monitoring sustainability and in maintaining consistent water quality in bottled water.</p> |
| Camera versus Trap Sampling: Improving how NOAA Samples Fish | <p>Underwater sampling with cameras has made fishery management more accurate for NOAA scientists.</p> |
| Statistical Analysis of a Randomized Study | <p>This education researcher uses measures of center and measures of variability for numerical data from random samples to draw informal comparative inferences about two populations.</p> |
Problem-Solving Tasks
| Name | Description |
| How Long is 30 Seconds? | The purpose of this task is for students to gain a better understanding of the passage of time. Students with the help of their teacher should work to design an investigation to find out how successful the class is at predicting when 30 seconds has passed. Once the data is recorded students should begin to graph their findings to make comparisons. |
| Don’t Spill the Beans! | The purpose of this task is for students to make a hypothesis, and then doing an experiment to test each students hypothesis. Students will collect and record their data, use graphical methods to describe their data, and finally analyze and interpret their results in the context of the activity. |
| Bear Hugs | In this problem solving activity, students are tasked with measuring the arm lengths of fellow students. Students will record the data and use it to construct a boxplot and scatterplot to help draw conclusions. |
| Offensive Linemen | In this task, students are able to conjecture about the differences and similarities in the two groups from a strictly visual perspective and then support their comparisons with appropriate measures of center and variability. This will reinforce that much can be gleaned simply from visual comparison of appropriate graphs, particularly those of similar scale. |
Virtual Manipulative
| Name | Description |
| Box Plotter | Users select a data set or enter their own data to generate a box plot. |
Student Resources
Problem-Solving Task
| Name | Description |
| Offensive Linemen: | In this task, students are able to conjecture about the differences and similarities in the two groups from a strictly visual perspective and then support their comparisons with appropriate measures of center and variability. This will reinforce that much can be gleaned simply from visual comparison of appropriate graphs, particularly those of similar scale. |
Virtual Manipulative
| Name | Description |
| Box Plotter: | Users select a data set or enter their own data to generate a box plot. |
Parent Resources
Problem-Solving Task
| Name | Description |
| Offensive Linemen: | In this task, students are able to conjecture about the differences and similarities in the two groups from a strictly visual perspective and then support their comparisons with appropriate measures of center and variability. This will reinforce that much can be gleaned simply from visual comparison of appropriate graphs, particularly those of similar scale. |