
General Information
Clusters should not be sorted from Major to Supporting and then taught in that order. To do so would strip the coherence of the mathematical ideas and miss the opportunity to enhance the major work of the grade with the supporting clusters.
Test Item Specifications
Items requiring operations on fractions must adhere to the Assessment Limits for that operation’s corresponding standard.
No
Allowable
Sample Test Items (4)
| Test Item # | Question | Difficulty | Type |
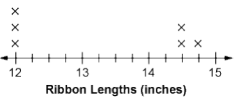
| Sample Item 1 | A line plot with Kelly's lengths of ribbons is shown.
What is the total length, in inches, of the longest piece and shortest piece of ribbon? |
N/A | EE: Equation Editor |
| Sample Item 2 | A line plot with Kelly's lengths of ribbons is shown. She adds another ribbon so that the difference between the longest ribbon and shortest ribbon is
What length of ribbon, in inches, could Kelly have added? |
N/A | EE: Equation Editor |
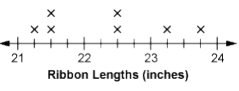
| Sample Item 3 | A line plot with Kelly’s ribbon lengths is shown. She adds two more ribbons so that the total length of ribbon is 200 inches.
What are two possible lengths of ribbon, in inches, that Kelly could have added? |
N/A | EE: Equation Editor |
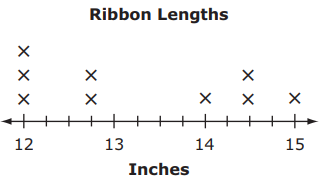
| Sample Item 4 | Kelly has nine pieces of ribbon. She recorded the length of each piece in
the line plot shown.
What is the total length of the three longest pieces of ribbon?
|
N/A | MC: Multiple Choice |
 inches.
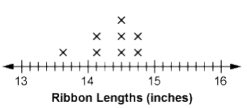
Related Courses
| Course Number1111 | Course Title222 |
| 5012070: | Grade Five Mathematics (Specifically in versions: 2014 - 2015, 2015 - 2022, 2022 - 2024, 2024 and beyond (current)) |
| 5020060: | Science - Grade Five (Specifically in versions: 2014 - 2015, 2015 - 2022, 2022 - 2024, 2024 and beyond (current)) |
| 5021070: | Social Studies Grade 5 (Specifically in versions: 2014 - 2015, 2015 - 2022, 2022 - 2023, 2023 - 2024, 2024 and beyond (current)) |
| 7712060: | Access Mathematics Grade 5 (Specifically in versions: 2014 - 2015, 2015 - 2018, 2018 - 2022, 2022 and beyond (current)) |
| 7720060: | Access Science Grade 5 (Specifically in versions: 2014 - 2015, 2015 - 2018, 2018 - 2023, 2023 and beyond (current)) |
| 5020120: | STEM Lab Grade 5 (Specifically in versions: 2016 - 2022, 2022 - 2024, 2024 and beyond (current)) |
| 5012065: | Grade 4 Accelerated Mathematics (Specifically in versions: 2019 - 2022, 2022 - 2024, 2024 and beyond (current)) |
| 5012015: | Foundational Skills in Mathematics 3-5 (Specifically in versions: 2019 - 2022, 2022 - 2024, 2024 and beyond (current)) |
Related Resources
Formative Assessments
| Name | Description |
| Bulk Candy Part Two | Students analyze data presented in a line plot and solve problems related to the data. |
| Bulk Candy Part One | Students are asked to use a given set of data to create a line plot with an appropriate scale. |
| Rock Measurements Part Two | Students analyze data presented in a line plot and solve problems related to the data. |
| Rock Measurements Part One | Students are asked to use a given set of data to create a line plot with an appropriate scale. |
Lesson Plans
| Name | Description |
| Line Plotting with Fractions Chicago Pizza Style | In this lesson, students will be making a line plot and recording fractional data (1/4, 1/2, and 3/4) on their line plot. Students will then use fraction operations to solve problems involving data presented in their line plots. |
| April Showers Bring May Flowers - Line Plots | In this lesson, students will create a line plot that displays rainfall data. They will use the data from the line plot to answer questions using addition, subtraction, multiplication, and division of fractions. Please note that the denominators for the line plot go to eighths.
|
| What is in the PLOT? | In this lesson students will use Florida's wonderful seashells to collect data sets of measurement in fractions of a unit (1/2, 1/4, 1/8). They will plot the data on a line plot, then use operations with fractions to solve problems involving information presented in the line plot. |
Original Student Tutorials
| Name | Description |
| Grasshopper Hut for Gus: Line Plots | Help build a Grasshopper Hut for Gus by creating line plots and answering questions about the line plots in this interactive tutorial. |
| Samantha’s Shell-Collecting Adventure | Learn to interpret data presented on a line plot and use operations on fractions to solve problems involving information presented in line plots as you complete this beach-themed, interactive tutorial. |
Tutorial
| Name | Description |
| Redistributing Trail Mix | This Khan Academy tutorial video presents a strategy for solving the following problem: given a dot plot with different measurements of trail mix in bags, find the amount of trail mix each bag would contain, if the total amount in all the bags was equally redistributed. |
Virtual Manipulative
| Name | Description |
| KidsZone: Create a Graph | Create bar, line, pie, area, and xy graphs. |
Student Resources
Original Student Tutorials
| Name | Description |
| Grasshopper Hut for Gus: Line Plots: | Help build a Grasshopper Hut for Gus by creating line plots and answering questions about the line plots in this interactive tutorial. |
| Samantha’s Shell-Collecting Adventure: | Learn to interpret data presented on a line plot and use operations on fractions to solve problems involving information presented in line plots as you complete this beach-themed, interactive tutorial. |
Tutorial
| Name | Description |
| Redistributing Trail Mix: | This Khan Academy tutorial video presents a strategy for solving the following problem: given a dot plot with different measurements of trail mix in bags, find the amount of trail mix each bag would contain, if the total amount in all the bags was equally redistributed. |