General Information
Subject Area: Mathematics (B.E.S.T.)
Grade: 912
Strand: Data Analysis and Probability
Date Adopted or Revised: 08/20
Status: State Board Approved
Benchmark Instructional Guide
Connecting Benchmarks/Horizontal Alignment
Terms from the K-12 Glossary
- Categorical data
- Bivariate data
- Conditional relative frequency
- Joint relative frequency
Vertical Alignment
Previous Benchmarks
Next Benchmarks
Purpose and Instructional Strategies
In grades 7 and 8, students have not worked specifically with two-way tables, however, they have examined sample spaces and utilized tree diagrams to create a sample space. In Algebra I, students began to explore two-way tables. In Mathematics for College Statistics, students work with bivariate numerical data and bivariate categorical data. When analyzing bivariate categorical data, students should utilize two-way tables to summarize results and to determine possible associations.- Instruction of constructing relative frequency two-way tables is interwoven with instruction on two-way tables using frequencies. A two-way table can also be referred to as a contingency table or joint frequency table.
- Instruction relates the relative frequencies to the probabilities for the events summarized in the table and that the sum of the joint relative frequencies should add to be 100%.
- As noted in the clarifications, students should be given some of the values and use the properties of two-way tables to find the missing values. Emphasize that the joint relative frequencies can be added vertically and horizontally to find the total row and total column.
- As noted in the clarifications, tree diagrams can be used as an alternative display. One of the categorical variables is used for the initial separation and then the other categorical variable is used for a secondary separation.
- For example, the two-way table from the example in the benchmark would relate to the tree diagram below.
.png)
Common Misconceptions or Errors
- Students may try to input a given conditional relative frequency in place of the joint relative frequency in the two -way table. Constructing the tree diagram can help with this.
- Students may leave off the total row or total column in a contingency table.
- Students may have difficulty when relative frequencies are given in decimal form.
- Students may be unable to correctly construct a two-way table if given a tree-diagram specially because the middle branch of percentages does not appear in the table at all.
Instructional Tasks
Instructional Task 1 (MTR.2.1, MTR.4.1, MTR.7.1)- Suppose that 3% of Olympians have taken a banned performance-enhancing substance. If an Olympian has used one of these substances, he or she has a 95% chance of receiving a positive drug test. If an Olympian has not taken one of these substances, he or she has a 2% chance of receiving a positive drug test.
- Part A. Construct either the corresponding relative frequency two-way table or the tree diagram for the scenario.
- Part B. Using your two-way table, what is the relative frequency of a false positive - a positive drug test for someone who has not used a banned performance- enhancing substance?
- Part C. Have a class discussion about the benefits or drawbacks of using the different diagrams from Part A.
Instructional Task 2 (MTR.6.1, MTR.7.1)
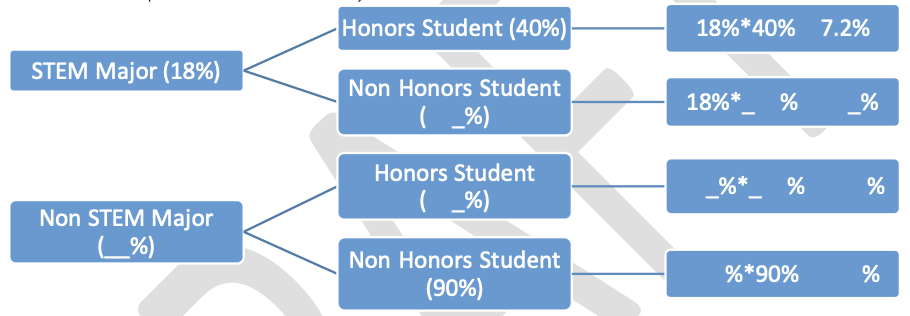
- The dean of science and math at a Florida college looks at the relative frequencies of students at her campus who are science, technology, engineering and math (STEM) majors; who are non-STEM students; who are honors students; and who are non-honors students.
Some of the relative frequencies from her findings are in the tree diagram above.
- Part A. Fill in the missing components of the tree diagram. Do your results make sense? Justify your reasoning.
- Part B. Use the tree diagram to construct a relative frequency table for this information.
- Part C. What are the two categorical variables being studied?
Instructional Items
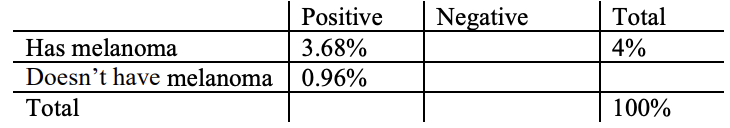
Instructional Item 1- A study shows that about 4% of men develop the skin cancer melanoma in their lifetime. Current medical testing is not always completely accurate. In cases where a man actually had melanoma, his test result came back positive about 92% of the time. In a case where a man did not actually have melanoma, his test came back positive about 1% of the time. Complete the table.