Standard #: MA.912.DP.3.1


This document was generated on CPALMS - www.cpalms.org


Construct a two-way frequency table summarizing bivariate categorical data. Interpret joint and marginal frequencies and determine possible associations in terms of a real-world context.


Examples


Algebra 1 Example: Complete the frequency table below. 

  Has an A in mathDoesn't have an A in math  Total
 Plays an instrument 20  90
 Doesn't play an instrument 20  
 Total   350

Using the information in the table, it is possible to determine that the second column contains the numbers 70 and 240. This means that there are 70 students who play an instrument but do not have an A in math and the total number of students who play an instrument is 90. The ratio of the joint frequencies in the first column is 1 to 1 and the ratio in the second column is 7 to 24, indicating a strong positive association between playing an instrument and getting an A in math.


General Information

Subject Area: Mathematics (B.E.S.T.)
Grade: 912
Strand: Data Analysis and Probability
Date Adopted or Revised: 08/20
Status: State Board Approved

Benchmark Instructional Guide

Connecting Benchmarks/Horizontal Alignment


Terms from the K-12 Glossary

  • Bivariate data 
  • Categorical data 
  • Joint frequency 
  • Joint relative frequency
 

Vertical Alignment

Previous Benchmarks 

Next Benchmarks


Purpose and Instructional Strategies

In grade 8, students began their exploration of bivariate data. Students focused on informally finding the line of fit. In Algebra I, students studied bivariate categorical data and displayed it in tables showing joint frequencies and marginal frequencies. In Mathematics for College Statistics, students continue this exploration with the use of real-world data. 
  • Instruction includes the connection to MA.912.DP.1.1 where students work with categorical bivariate data and display it in tables. A two-way frequency table is just a way to display frequencies jointly for two categories. 
  • In later courses, students may hear the term for two-way tables as contingency tables. Instruction includes the use of both terms interchangeably so that students are familiar with them. 
  • Students are expected to interpret the joint and marginal frequencies and therefore must know the differences between these two. 
    • Marginal frequencies 
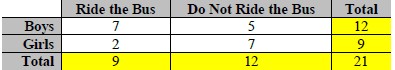
      • Entries in the “Total” row and “Total” columns are called marginal frequencies. The areas highlighted in yellow in the table below represent the marginal frequencies. 
        Table
    • Joint frequencies 
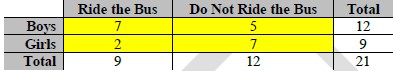
      • Entries in the body of the table represent joint frequencies. The area highlighted in yellow in the table represents the joint frequencies. 
        Table
  • Instruction includes students creating two-way (contingency) tables from data that has either been collected or researched. Students can then analyze the data by either examining joint relative frequencies or marginal relative frequencies. 
  • Instruction includes determining possible association. Two categorical variables are associated if the row of conditional relative frequencies (or column of relative frequencies) are different for the rows (or columns) of the table. Evidence of an association is strongest when the conditional relative frequencies are quite different. If the conditional relative frequencies are nearly equal for all categories, then there is probably not an association between variables. 
  • Instruction includes determining if variables are independent. If the conditional relative frequencies are nearly equal for all categories, there may be no association between the variables and they are said to be independent.
  • Instruction includes experience with the Simpson’s Paradox. Simpson’s Paradox is an association or comparison that holds for all of several groups can reverse direction when the data are combined to form a single group. 
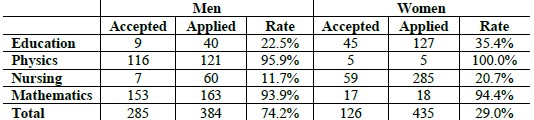
    • For example, a university was concerned with the number of females who were being accepted into their graduate programs. Of the 384 men who applied to the school, 285 were admitted which is an admission rate of 74.2%. Of the 435 women who applied to the school, 126 were admitted which is an admission rate of 29.0%. This may suggest there is a bias where men are favored in graduate admissions. However, upon closer inspection of the graduate programs they offered, the following was discovered: 
      Table
    • When looking at the individual programs and comparing the acceptance rate of women versus that of men, they noticed that more women were being accepted into these programs then men were. This is an example of a Simpson’s Paradox. When the data is combined into a single group, we get one result. When the data is divided into several groups, the results are reversed.
 

Common Misconceptions or Errors

  • Students may have difficulty when completing the table based on the given data. 
  • Students may not distinguish the differences between marginal and joint frequencies. 
  • Students may make errors when identifying the relationship and possible associations in the data in terms of the given context. 
  • Students may find the relative joint frequencies of the column only and not realize that to find the relative joint frequency depends on what is being analyzed and could be based on the row.
 

Strategies to Support Tiered Instruction

Instructional Tasks

Instructional Task 1 (MTR.3.1, MTR.7.1
The U.S. Department of Transportation Federal Highway Administration performed a National Household Travel Survey. Within that survey, they looked at trends in the annual number (millions) of person trip by mode of transportation. The following is the data from 2017  (https://nhts.ornl.gov/assets/2017_nhts_summary_travel_trends.pdf ): 
  • Private Vehicle: to and from work: 56,981; work-related business: 4,844; shopping and errands: 126,268; school or church: 28,427; social and recreational: 78,890; other: 10,988 
  • Public Transit: to and from work: 3,537; work-related business: 208; shopping and errands: 2,586; school or church: 1,009; social and recreational: 1,618; other: 487 
  • Walk: to and from work: 2,523; work-related business: 510; shopping and errands: 11,496; school or church: 4,146; social and recreational: 18,483; other: 1,790 
  • Other: to and from work: 1,540; work-related business: 486; shopping and errands: 2,404; school and church: 6,721; social and recreational: 3,330; other: 1,873 
      Part A. Create a contingency table using the data provided. 
      Part B. What is the joint relative frequency of people who used public transit traveled for work related business? 
      Part C. What is the marginal relative frequency of those who traveled for shopping and errands? 
      Part D. What is the joint relative frequency of people who traveled to and from work by using a private vehicle? 
      Part E. Which mode of transportation was most popular as it relates to social and recreational trips? 
      Part F. Does the data show an association between using a personal vehicle and going to school or church? Justify your reasoning.


Instructional Items

Instructional Item 1 
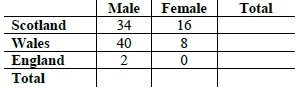
The results from a survey about whether students (male or female) at a university were from England, Wales or Scotland is summarized in the following two-way table: 

Table
       Part A. Complete the table with the totals. 
       Part B. What proportion of the students are women? 
       Part C. What proportion of students are from Wales? 
       Part D. Is it fair to say that more students from Wales are women? Explain your reasoning.


*The strategies, tasks and items included in the B1G-M are examples and should not be considered comprehensive.


Related Courses

Course Number1111 Course Title222
1200310: Algebra 1 (Specifically in versions: 2014 - 2015, 2015 - 2022, 2022 and beyond (current))
1200320: Algebra 1 Honors (Specifically in versions: 2014 - 2015, 2015 - 2022, 2022 and beyond (current))
1200380: Algebra 1-B (Specifically in versions: 2014 - 2015, 2015 - 2022, 2022 and beyond (current))
1200400: Foundational Skills in Mathematics 9-12 (Specifically in versions: 2014 - 2015, 2015 - 2022, 2022 and beyond (current))
1210300: Probability and Statistics Honors (Specifically in versions: 2014 - 2015, 2015 - 2019, 2019 - 2022, 2022 and beyond (current))
7912090: Access Algebra 1B (Specifically in versions: 2014 - 2015, 2015 - 2018, 2018 - 2019, 2019 - 2022, 2022 and beyond (current))
1200315: Algebra 1 for Credit Recovery (Specifically in versions: 2014 - 2015, 2015 - 2022, 2022 and beyond (current))
1200385: Algebra 1-B for Credit Recovery (Specifically in versions: 2014 - 2015, 2015 - 2022, 2022 and beyond (current))
7912075: Access Algebra 1 (Specifically in versions: 2014 - 2015, 2015 - 2018, 2018 - 2019, 2019 - 2022, 2022 and beyond (current))
1210305: Mathematics for College Statistics (Specifically in versions: 2022 and beyond (current))
1200388: Mathematics for Data and Financial Literacy Honors (Specifically in versions: 2022 and beyond (current))
1200384: Mathematics for Data and Financial Literacy (Specifically in versions: 2022 and beyond (current))
7912120: Access Mathematics for Data and Financial Literacy (Specifically in versions: 2022 - 2023, 2023 and beyond (current))


Related Access Points

Access Point Number Access Point Title
MA.912.DP.3.AP.1 When given a two-way frequency table summarizing bivariate categorical data, identify joint and marginal frequencies.


Related Resources

Formative Assessments

Name Description
Two-Way Relative Frequency Table

Students are asked to convert raw data to relative frequencies by both rows and columns given a two-way frequency table.

Music and Sports

Students are asked to construct a two-way frequency table given a set of raw data.

Marginal and Joint Frequency

Students are asked to use a two-way frequency table to interpret marginal and joint relative frequencies.

Who Is a Vegetarian?

Students are given a two-way frequency table and asked to determine if there is a relationship between the two variables.

Breakfast Drink Preference

Students are asked to use data from a survey to create a two-way frequency table.

Lesson Plans

Name Description
Taxes using Two-Way Frequency Tables

Students will construct a two-way frequency table of different levels of government and the imposed gasoline taxes in Florida. Students will learn about marginal and joint frequencies. This is lesson three of a 3-part integrated mathematics and civics mini-unit.

Investigating Relationships With Two-Way Frequency Tables

In this lesson, students are introduced to two-way frequency tables. They will calculate joint, marginal, and relative frequencies and draw conclusions about the relationship between two categorical variables.

Can You Walk in My Shoes?

Students use real-life data to create dot-plots and two-way tables. Students will collect data at the beginning of the lesson and use that data to create double dot plots and frequency tables, finding and interpreting relative frequencies.

The assignment allows students to work collaboratively and cooperatively in groups. They will communicate within groups to compare shoes sizes and ages to acquire their data. From the collection of data they should be able to predict, analyze and organize the data into categories (two-way tables) or place on a number line (dot-plot).

As the class assignment concludes, a discussion of the final class display should take place about the purchasing of shoes versus ages and the relationship that either exists or doesn't exist.

How Random is "Shuffle Mode"?

Today's teenager is a savvy consumer of digital music and the constantly-evolving technology that plays it. Ask a typical student what they know about iTunes versus Pandora versus Spotify—most of them will have an opinion on the "best" service for listening to songs. This lesson links students' existing interest in music with the mathematical topics of frequency and relative frequency.

The activity assumes that students know what Shuffle Mode does when they listen to digital music. Shuffle Mode is a function on digital music players that "shuffles" or randomly rearranges the order of a list of songs. Each time a person presses Shuffle Mode, the playlist is rearranged. If we assume a music player's Shuffle Mode is truly random, the chances of any particular song being played would equal 1 divided by the total number of songs (1/total #). This is analogous to rolling a fair die; each number on the die has an equal probability of being rolled (1/6 or 16.7%).

Dropping Out or Staying In: Two-Way Table Analysis

This lesson will require students to calculate relative frequencies and determine if an association exists within a two-way table. The students will analyze the frequencies and write a response justifying the associations and trends found within the table.

What's your preference?

In this lesson, students will collect data and construct two-way frequency tables. They will analyze the two-way frequency table by calculating relative conditional frequencies.

What's Your Story?: Exploring Marginal and Conditional Distributions Through Social Networks

In this interactive lesson, students explore marginal and conditional distributions. Students will calculate the relative frequency of data collected about cell phone use and social media access. These categories can be adjusted as necessary.

Relative Frequency Tables... with extra cheese!

Have students get colorful in defining marginal, joint and conditional frequencies of two-way frequency tables. Students will take charge in justifying the associations they find in the tables.

High School Dropouts

Students will examine dropout rates in the United States in 2012 by gender and race using data provided by the National Center for Education Statistics. Students will create conditional relative frequency tables to interpret the data and identify associations between genders, races, and dropout rates.

It's Your Choice

In groups, students will analyze associations between categorical data by constructing two-way frequency tables and two-way relative frequency tables. Students will analyze and interpret the results and present their findings to their classmates.

Breakfast for Champions?

Students will create and interpret two-way frequency tables using joint, marginal, and conditional frequencies in context. They will investigate whether breakfast is for champions.

Using Two-Way Frequency Tables to Analyze Data

The television program, 60 Minutes reports that parents are intentionally holding their children back in kindergarten to give them a competitive advantage in sports later on in life. The students will use data collected to decide if this is truly a trend in the United States.

Comedy vs. Action Movies Frequency Interpretation

Using a completed survey of male and female student interest in comedy vs. action movies, the students will create a two-way frequency table using actual data results, fraction results, and percent results. The students will then act as the movie producer and interpret the data to determine if it is in their best interest to make a comedy or action movie. As the Summative Assessment, the student will take on the job/role of an actor/actress and interpret the data to support their decision.

Show Me the Money

Students will create a statistical question and collect and analyze data using relative frequency tables. They will present their argument in hopes of earning a cash prize for their philanthropy. An iterative process of critique and refinement will take place. A student packet is included that guides all parts of the lesson.

Quantitative or Qualitative?

This lesson examines the differences between quantitative and qualitative data and guides students through displaying quantitative data on a scatter plot and then separating the data into qualitative categories to be displayed and interpreted in a two-way frequency table.

Are you a CrimiNole or Gatorbait? Two rivalries in one table!

This is an introduction to two-way frequency tables. The lesson will be delivered using a PowerPoint presentation. The teacher will introduce and define joint and marginal frequency, demonstrate how two-way frequency tables are constructed from a given set of data, calculate relative frequencies, and draw conclusions based on the information in the table. Students will practice these skills through guided practice with the teacher, independent practice, and complete a summative assessment to measure student learning. All resources, including the PowerPoint, have been provided.

Two-Way Math Survey

In this lesson, students will construct a two-way table based on data given. They will interpret the data to find if there is a correlation between the two variables from the same subject. As the lesson progresses, students will create their own testable questions that they will collect data on using the survey method. Students will show their mastery of this math concept with the presentation of the data in a two-way table and interpretation of the data to draw inferences.

Can You Make Heads or Tails of It?

Students learn how to make two-way tables, frequency, and relevant frequency tables. Students make predictions, collect data, and display it in two-way tables for interpretation.

Two-Way Frequency Table and Relative Frequency

In this lesson, the student will learn how to set up a two-way frequency table from two categorical variables and use the two-way frequency table to calculate frequency counts and relative frequency. The vocabulary terms learned in this lesson are two-way frequency table, relative frequency, joint frequency, marginal frequency, and conditional frequency.

How hot are hot dogs?

In this lesson, students will learn how to convert simple and two-way frequency tables into relative frequency tables using data collected in the classroom.

Problem-Solving Tasks

Name Description
The Titanic 1

This task asks students to calculate probabilities using information presented in a two-way frequency table.

Music and Sports

This task asks the student to gather data on whether classmates play an instrument and/or participate in a sport, summarize the data in a table and decide whether there is an association between playing a sport and playing an instrument. Finally, the student is asked to create a graph to display any association between the variables.

Student Resources

Problem-Solving Tasks

Name Description
The Titanic 1:

This task asks students to calculate probabilities using information presented in a two-way frequency table.

Music and Sports:

This task asks the student to gather data on whether classmates play an instrument and/or participate in a sport, summarize the data in a table and decide whether there is an association between playing a sport and playing an instrument. Finally, the student is asked to create a graph to display any association between the variables.


Parent Resources

Problem-Solving Tasks

Name Description
The Titanic 1:

This task asks students to calculate probabilities using information presented in a two-way frequency table.

Music and Sports:

This task asks the student to gather data on whether classmates play an instrument and/or participate in a sport, summarize the data in a table and decide whether there is an association between playing a sport and playing an instrument. Finally, the student is asked to create a graph to display any association between the variables.


Printed On:3/28/2024 11:53:45 AM
Print Page | Close this window