General Information
Subject Area: Mathematics (B.E.S.T.)
Grade: 912
Strand: Functions
Date Adopted or Revised: 08/20
Status: State Board Approved
Benchmark Instructional Guide
Connecting Benchmarks/Horizontal Alignment
- MA.912.AR.2.4
- MA.912.AR.2.5
- MA.912.AR.3.7
- MA.912.AR.3.8
- MA.912.AR.4.4
- MA.912.AR.5.6
- MA.912.AR.5.7
- MA.912.AR.5.8
- MA.912.AR.5.9
- MA.912.F.1.1
Terms from the K-12 Glossary
- Transformation
- Translation
Vertical Alignment
Previous Benchmarks
Next Benchmarks
Purpose and Instructional Strategies
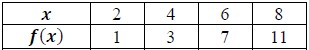
In grade 8, students performed single transformations on two-dimensional figures. In Algebra I, students identified the effects of single transformations on linear, quadratic and absolute value functions. In Geometry, students performed multiple transformations on two-dimensional figures. In Mathematics for College Algebra, students identify effects of transformations on linear, quadratic, exponential, logarithmic and absolute value functions.- In this benchmark, students will create a table, equation or graph of a transformed function defined by adding a real number to the -or -values or multiplying the -or -values by a real number.
- Instruction includes the use of a graphic software to ensure adequate time for students to examine multiple transformations on the graphs of functions.
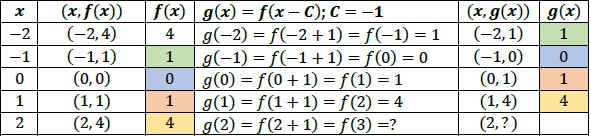
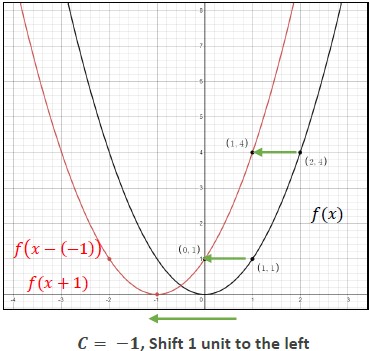
- Given a function , the transformed function () = ( − ) is a horizontal shift of (). Adding a real number, , to all the inputs (-values) of a function will result in shifting the output left or right depending on the sign of . If > is positive, the graph will shift right. If is negative, the graph will shift left.
- Given a function , the transformed function () = () + is a vertical shift of (). Adding a real number, , to all the outputs (-values) of a function will result in shifting the output up or down depending on the sign of . If is positive the graph will shift up, and if is negative the graph will shift down.
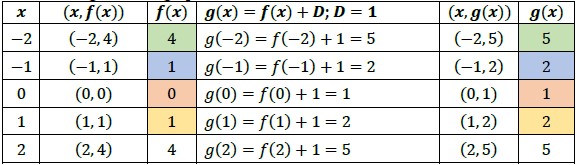
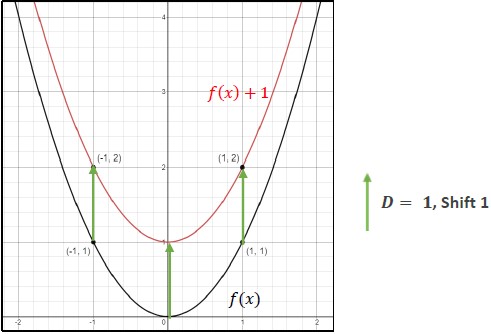
- Discuss with the students that as well as translations of two-dimensional figures, adding a constant to either the input or output of a function change the position of the graph, but it doesn’t change the shape of the graph (MTR.4.1).
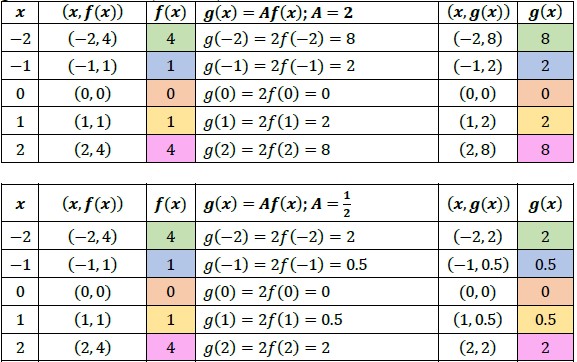
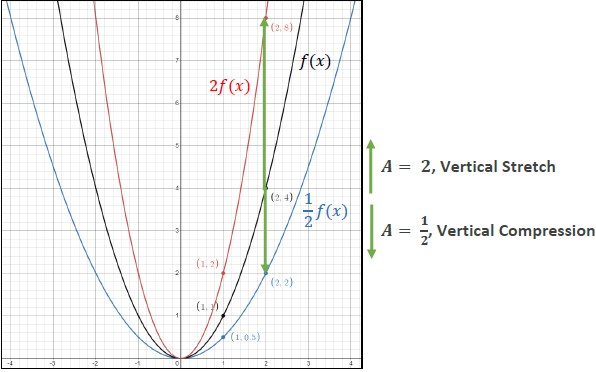
- Given a function , the transformed function () = () is a vertical stretch or compression of (). Multiplying all the outputs (-values) of a function by a real number, , will result in a vertical stretching or compression depending on the value of . If is between 0 and 1 (0 < < 1), the graph will be vertically compressed and if is greater than 1 ( > 1), the graph will be vertically stretched.
- If is a negative number ( < 0), the transformed graph will be a combination of a vertical stretch or compression and a reflection over the -axis. Discuss with students how multiplying all the -values by −1 is the same as reflecting a two-dimensional figure over the -axis (MTR.4.1).
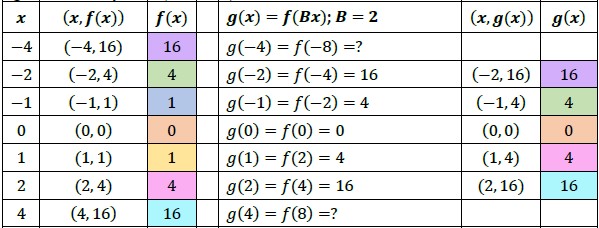
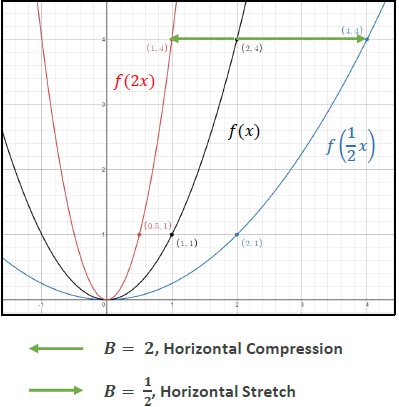
- Given a function , the transformed function () = () is a horizontal stretch or compression of (). Multiplying all the inputs (-values) of a function by a real number, , will result in a horizontal stretching or compression depending on the value of . If is between 0 and 1 (0 < <1), the graph will be horizontally stretched by and if is greater than 1 ( > 1), the graph will be horizontally compressed by
- If is a negative number ( < 0), the transformed graph will be a combination of a horizontal stretch or compression and a reflection over the -axis. Discuss with students how multiplying all the -values by −1 is the same as reflecting a two-dimensional figure over the -axis (MTR.4.1).
- Discuss with students the meaning of () = (2). In this case, the output value, (), is the same as the output value of () at an input that is twice the size.
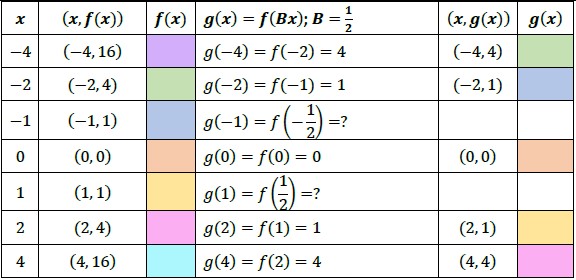
- Discuss with students the meaning of () = (()). In this case the output value, () is the same as the output value of () at an input that is half the size. Example: (4) = ( · 4) = (2)=4 (MTR.4.1).
Common Misconceptions or Errors
- Some students may have difficulty seeing the impact of a transformation when comparing tables and graphs. In these cases, encourage students to convert the graph to a second table, using the same domain as the first table. This should aid in comparisons (MTR.2.1).
- Some students misinterpret how the parameters of the equation of a transformed function are affected by a horizontal translation. This may indicate that students do not understand the relationship between the graph and the equation of the function.
- For example, a student may think that () = ( + 1) is a horizontal translation to the right because of the positive addend for . One potential teaching strategy would be using a graphing utility to graph the function () = ( − C)2 creating as slider, and then allowing students to explore the translation results as the value of the slider changes.
- Some students may have difficulties understanding that multiplying the input of a function by a number greater than 1 will result in a horizontal compression of the graph instead of a stretching. It is important to point out that multiplying the -value does not change the original value of the input. Because the input is being multiplied by a number greater than 1, a smaller input in the transformed function is needed to obtain the same output from the original function. One potential teaching strategy would be using a graphing utility to graph the function () = ()2 creating as slider, and then allowing students to explore the stretching/compression results as the value of the slider changes from 0 to 2. Remind students that negative values of will result in a vertical reflection of the function.
Instructional Tasks
Instructional Task 1 (MTR.2.1)- The figure shows the graph of a function whose domain is the interval −4 ≤ ≤4.
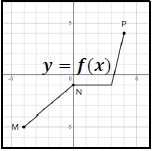
- Part A: Sketch the graph of each transformation described below and compare it with the graph of . Explain what you see.
a. () = () + 2
b. () = ( + 2)
c. () = 2()
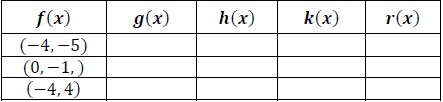
d. () = (2) - Part B: The points labeled , , on the graph of have coordinates = (−4, −5), = (0,−1,) and = (−4,4). Complete the table below with the coordinates of the points corresponding to , , on the graphs of , , and ?
Instructional Items
Instructional Item 1 (MTR.3.1)- Given the function () = ||, graph the function () and the transformation () = ( − 3) on the same axes. What do you notice about the -intercepts of ()?
Instructional Item 2 (MTR.3.1)
- Given the function () = log x, graph the function () and the transformation () = 3() on the same axes. Describe the transformed function, (), as it relates to the graph of ().
Instructional Item 3 (MTR.3.1)
- A function () is given. Create a table for the functions below
a. () = () + 5
b. () = (2)