
General Information
Subject Area: Mathematics (B.E.S.T.)
Grade: 912
Strand: Functions
Date Adopted or Revised: 08/20
Status: State Board Approved
Benchmark Instructional Guide
Connecting Benchmarks/Horizontal Alignment
- MA.912.AR.2.4
- MA.912.AR.2.5
- MA.912.AR.3.7
- MA.912.AR.3.8
- MA.912.AR.4.4
- MA.912.AR.5.6
- MA.912.AR.5.7
- MA.912.AR.5.8
- MA.912.AR.5.9
- MA.912.F.1.1
Terms from the K-12 Glossary
- Transformation
- Translation
Vertical Alignment
Previous Benchmarks
Next Benchmarks
Purpose and Instructional Strategies
In grade 8, students performed single transformations on two-dimensional figures. In Algebra I, students identified the effects of single transformations on linear, quadratic and absolute value functions. In Geometry, students performed multiple transformations on two-dimensional figures. In Mathematics for College Algebra, students determine the type of transformations on linear, quadratic, exponential, logarithmic and absolute value functions.- Instruction includes identifying function transformations involving a combination of translations, dilations and reflections, and determining the value of the real number that defines each of the transformations.
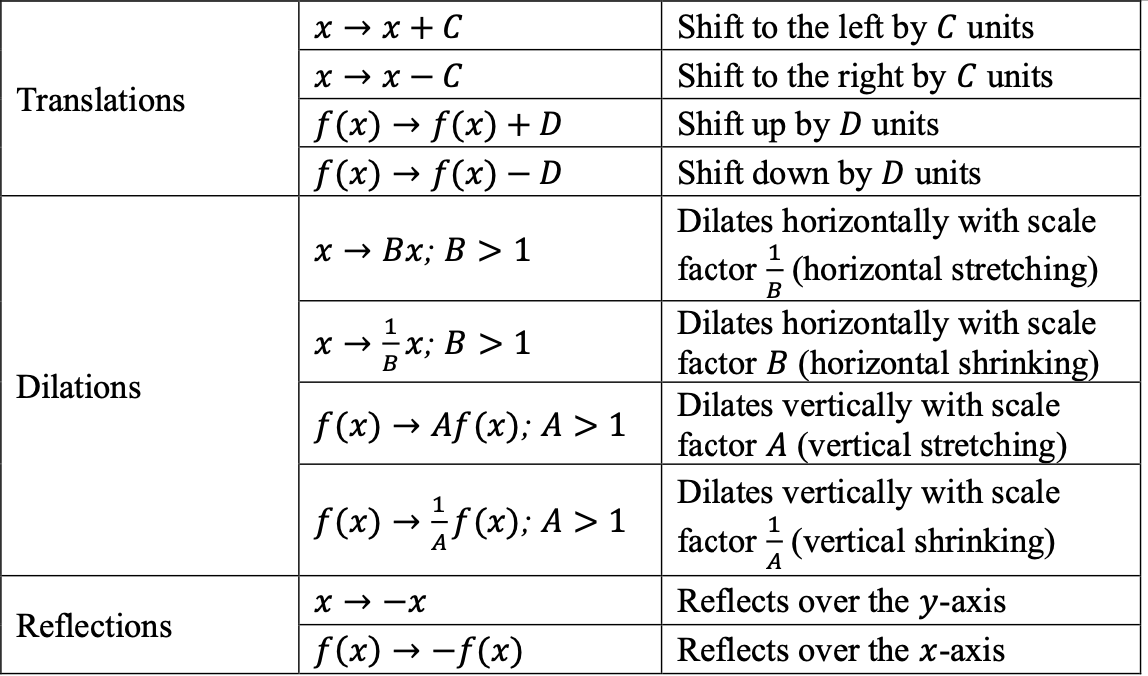
- Transformations can be either horizontal (changes to the input: ) or vertical (changes to the output: ()).
- There are three different types of transformations: translations, dilations, and reflections.
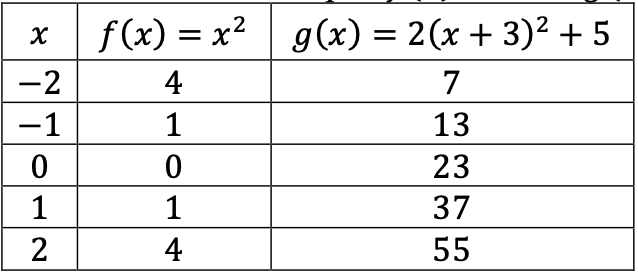
- By combining single transformations, a parent function can become a more advanced function. () = → () = (( + ) + )Example: () = 2 → () = 2( + 3)2 + 5
- By combining single transformations, a parent function can become a more advanced function.
- Using a graphing utility can help students understand how changing the value of the real numbers in the function’s equation change its graph.
- Encourage student’s discussion about the effects of changing the value of the real numbers , , and in the equation of the function. Ask them to generalize their findings.
Common Misconceptions or Errors
- Some students may have difficulty seeing the impact of a transformation when comparing tables and graphs. In these cases, encourage students to convert the graph to a second table, using the same domain as the first table. This should aid in comparisons.
- Similar to writing functions in vertex form, students may confuse effect of the sign of in ( + ). Direct these students to examine a graph of the two functions to see that the horizontal shift is opposite of the sign of .
- Vertical stretch/compression can be hard for students to see on linear functions initially and they may interpret stretch/compression as rotation. Introduce the effects of () and () by using a quadratic or absolute value function first before analyzing the effect on a linear function.
- Students may think that a vertical and horizontal stretch from () and () look the same. For linear and quadratic functions, it can help to have a non-zero -intercept to visualize the difference.
Instructional Tasks
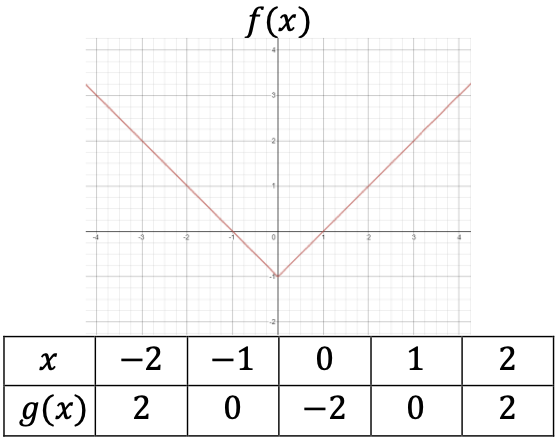
Instructional Task 1 (MTR.3.1)- A graph and table, which represents an absolute value function, are shown below. Describe and determine the value of the real number that defines the transformation from () to ().
Instructional Task 2 (MTR.3.1)
- Describe the transformations that maps the function () = 2 to each of the following. () = 2-2 () = 4+ 3
() = 2 − 3 ()= 3(2 + 1)+2
Instructional Items
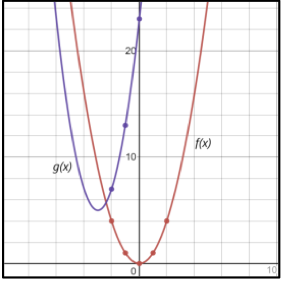
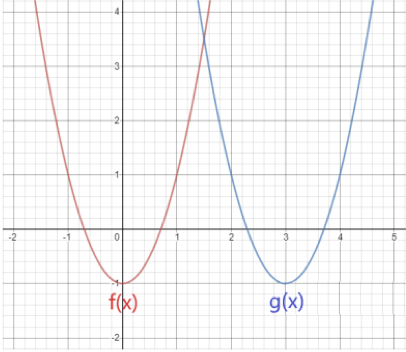
Instructional Item 1- Considering the graph of () and () below, describe the transformation and determine the value of the real number, , that defines the transformation from () to ().
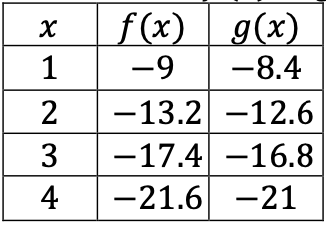
- Considering the table below, describe the transformation and determine the value of the real number, , that defines the transformation from () to ().
 .
.