
 and
and  .
.General Information
Subject Area: Mathematics (B.E.S.T.)
Grade: 912
Strand: Functions
Date Adopted or Revised: 08/20
Status: State Board Approved
Benchmark Instructional Guide
Connecting Benchmarks/Horizontal Alignment
Terms from the K-12 Glossary
- Exponential Function
- Function
- Linear Function
- Quadratic Function
Vertical Alignment
Previous Benchmarks
Next Benchmarks
Purpose and Instructional Strategies
In grade 8, students identified the domain and range of a relation and determined whether it is a function or not. In Algebra I, students classify function types limited to simple linear, quadratic, cubic, square root, cube root, absolute value and exponential functions. In later courses, students will classify other function types.- The purpose of this benchmark is to lay the groundwork for students to be able to choose appropriate functions to model real-world data.
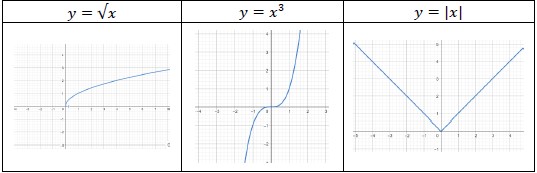
- Instruction includes the connection of the graph to its parent function. See Clarification 1 for specifics of the Algebra I course.
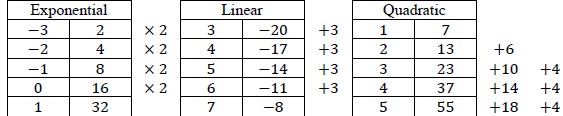
- Students will work extensively with linear, quadratic and exponential models in the Algebra I course. Strong attention should be given to the other function types so that students can build familiarity with them. As new function types are introduced, take time to allow students to produce a rough graph of the parent function from a table of values they develop. Lead student discussion to build connections with why these function types produce their corresponding graphs (MTR.4.1).
- Instruction develops the understanding that if given a table of values, unless stated, one
cannot absolutely determine the function type, but state which function the table of
values could represent.
- For example, if given the function = || and only positive values were given in a table, one could say that table of values could represent a linear or absolute value function.
Common Misconceptions or Errors
- Some students may miscalculate first and second differences that deal with negative values, especially if they perform them mentally. In these cases, have students quickly write out the subtraction expression (i.e., −14 – (−2)) so they can see that they are subtracting a negative value and should convert it to adding a positive value.
Strategies to Support Tiered Instruction
- Teacher provides opportunities to write out subtraction sentences next to each line of the table when determining first and second differences.
- Instruction is provided to determine the type of function the graph represents. Knowledge on the end behavior of different types of functions may provide students with additional information to identify different types of functions. The teacher co-creates an anchor chart showing different types of functions and their end behavior
- Teacher provides methods for calculating and/or interpreting the first and second
differences given a table of values.
- Instruction includes opportunities to use graphing software to graph parent functions of
different equations (i.e., square root, cubic, absolute value, etc.).
Instructional Tasks
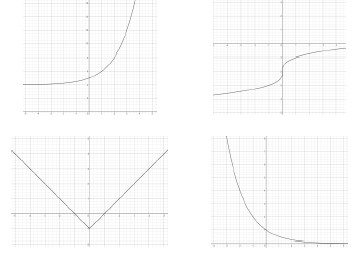
Instructional Task 1 (MTR.3.1)- Given the graphs below, identify each type function it represents. Justify your answer.
Instructional Items
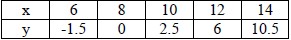
Instructional Item 1- Given the table below, determine the function type that could represent it.
*The strategies, tasks and items included in the B1G-M are examples and should not be considered comprehensive.