
 can be transformed into the straight line y=5t+2 by taking the natural logarithm of the function’s outputs.
General Information
Subject Area: Mathematics (B.E.S.T.)
Grade: 912
Strand: Algebraic Reasoning
Standard: Write, solve and graph exponential and logarithmic equations and functions in one and two variables.
Date Adopted or Revised: 08/20
Status: State Board Approved
Benchmark Instructional Guide
Connecting Benchmarks/Horizontal Alignment
- MA.912.NSO.1.2
- MA.912.NSO.1.7
- MA.912.AR.1.1
- MA.912.AR.1.2
- MA.912.AR.2.5
- MA.912.AR.3.8
- MA.912.AR.9.10
- MA.912.AR.10.2
- MA.912.F.1.2
- MA.912.F.3.2
- MA.912.FL.3
- MA.912.FL.4
Terms from the K-12 Glossary
- Domain
- Exponent
- Exponential function
- Function
- Set-builder notation
Vertical Alignment
Previous Benchmarks
Next Benchmarks
Purpose and Instructional Strategies
In Algebra I, students worked with exponential functions in limited forms. In Math for Data and Financial Literacy, students solve problems modeled with exponential functions.- Instruction focuses on real-world contexts that require students to create a function as a tool to determine requested information or should provide the group a function that models the context.
- For example, students can use exponential decay when analyzing the historical depreciation of a car. In MA.912.AR.2.5, students find the straight-line depreciation. In this benchmark, students could find the percentage the car depreciates instead of the dollar amount (exponential depreciation) using the equation = A(1 − ), where A is the starting value of the car, is the percent of depreciation, is the elapsed time in years, and is the value of the car after years.
- Instruction includes making the connection to logarithms when working with investments formulas involving exponents.
- For example, when using the formula A = P(1 + ) where is the interest rate expressed as a decimal, is the number of times the interest is compounded annually, and is the term of the account, students may need to use logarithms to find the value of a variable.
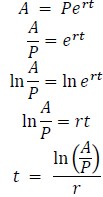
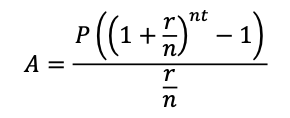
- For example, when using the formula A = P, students will need to use the natural logarithm to isolate the variables and .
- Instruction includes the use of technology and various representations of functions when solving problems. Given the complexity of the formulas in this course, it may be helpful for students to solve certain problems graphically rather than algebraically. Students can explore entering equations using graphing software.
- For example, if Sue deposited $5,000 into an account that compounds interest monthly with an annual rate (APR) of 1.5%, students can determine how long it will take until the account reaches $30,000 algebraically or graphically. To determine this graphically, students can graph the function = 5000(1 + )12 using technology. Students should realize that by finding where the graph reaches the -value of 30,000, the corresponding -value will provide how long it would take.
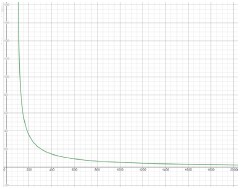
- For example, students can graph the equation 20000 =
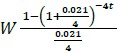 to
explore the relationship between the withdrawal amount and the time it takes to fully deplete a $20,000 balance from an account that compounds quarterly at 2.1%.
to
explore the relationship between the withdrawal amount and the time it takes to fully deplete a $20,000 balance from an account that compounds quarterly at 2.1%.
- Problem types include using instances when periodic deposits are made into an account, and using formulas to find the term of systematic savings account. The formula to calculate the future value of a periodic deposit investment is B =
 , and the formula for the present value of a periodic deposit investment is P =
  .
. - Problem types include using formulas to find the term of systematic withdrawals, which is when withdrawals are made at regular intervals. The formula to figure out the present
value is P =
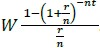 .
. - Be sure to highlight the relative ease and usefulness of graphing financial formulas to explore relationships. Graphs provide the visual data from an infinite number of calculations, saving students time and hassle when exploring relationships between variables.
- Instruction includes making connections to various forms of exponential functions to show their equivalency. Students should understand and interpret when solving the exponential in one form might be more useful than solving in another form depending on context.
- Instruction includes the use of - notation and function notation.
- Instruction includes representing domain, range and intervals where the function is
increasing, decreasing, positive or negative, using words, inequality notation, set-builder notation and interval notation.
- Words
If the domain is all real numbers, it can be written as “all real numbers” or “any value of , such that is a real number." - Inequality notation
If the domain is all values of greater than 2, it can be represented as > 2. - Set-builder notation
If the range is all values of less than or equal to zero, it can be represented as {| ≤ 0} and is read as “all values of such that is less than or equal to zero.” - Interval notation
If the domain is all values of less than or equal to 3, it can be represented as (−∞, 3]. If the domain is all values of greater than 3, it can be represented as (3, ∞). If the range is all values greater than or equal to −1 but less than 5, it can be represented as [−1, 5).
- Words
Common Misconceptions or Errors
- Ensure students are plugging the correct information into the formulas and using technology correctly. Grouping symbols on graphic software can be tricky. Model the entry of a few formulas with grouping symbols for students before releasing them to explore their own.
- Students may confuse finding the logarithm and natural logarithm.
Instructional Tasks
Instructional Task 1 (MTR.3.1, MTR.4.1)- Luisa deposited $15,000 into a savings account, which compounds interest monthly with an annual rate (APR) of 1.15%. Each month, she withdraws $350 from this account to pay for travel expenses.
- Part A. How long will it take until the account is fully depleted?
- Part B. How can she change the amount she withdrawals so her account lasts twice as long?
Instructional Task 2 (MTR.7.1)
- Han wants to set up a periodic investment account to save for a future car purchase. His goal is to save $40,000. The best account he’s found pays a 2.3% annual interest rate, compounded monthly. Use the periodic investment formula below to graph a relationship between the amount of his monthly periodic investment, P, and the time it will take to achieve his goal, .
Instructional Items
Instructional Item 1- Mindy purchased a 3-year-old car for $22,300. When the car was new, it sold for $35,500. Find the depreciation rate to the nearest hundredth of a percent.