
General Information
Subject Area: Mathematics (B.E.S.T.)
Grade: 912
Strand: Algebraic Reasoning
Date Adopted or Revised: 08/20
Status: State Board Approved
Benchmark Instructional Guide
Connecting Benchmarks/Horizontal Alignment
- MA.912.AR.2.5
- MA.912.AR.3.8
- MA.912.AR.5.7
- MA.912.AR.5.9
- MA.912.AR.9.10
- MA.912.F.1.1
- MA.912.F.1.2
- MA.912.F.1.3
- MA.912.F.1.6
- MA.912.F.2
Terms from the K-12 Glossary
- Absolute value
- Coordinate plane
Vertical Alignment
Previous Benchmarks
Next Benchmarks
Purpose and Instructional Strategies
In Algebra I, students graphed absolute value functions and interpreted its key features. In Math for College Algebra, students solve problems modeled with absolute value functions, determining key features and constraints within context.- When making connections to transformations of functions, use graphing software to explore absolute value functions adding variability to the parent equation to see the effects on the graph. Allow students to make predictions (MTR.4.1).
- Instruction includes making the connection between the algebraic and graphical representations. In doing so, students can tie together key feature concepts of absolute value functions and provides opportunities to make connections to linear functions and its key features.
- Students should understand that there are two ways in which absolute value functions can be represented algebraically (MTR.5.1).
- Using absolute value notation () = ||.
- Using piecewise notation () =
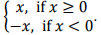
- The piecewise graph focuses on what should happen algebraically to the input value that will give its distance from the origin.
- Instruction includes utilizing students’ knowledge of transformations to graph absolute value functions that are not parent functions (MTR.2.1).
- For example, given () = | + 3|, to graph as a piecewise students can set the expression inside of the absolute value equal to zero to solve for the -value where the function equals zero. So any value of less than −3 and any value of greater than −3.
- Using Piecewise Notation ()
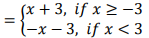
- Using Piecewise Notation ()
- For example, given () = | + 3|, to graph as a piecewise students can set the expression inside of the absolute value equal to zero to solve for the -value where the function equals zero. So any value of less than −3 and any value of greater than −3.
- Using the transformation criteria, students should understand that the graph of this function is a horizontal shift to the left. Points can be plotted using the slope of the function and other key features that it provides.
- Instruction reinforces the definition of absolute value as a number’s distance from zero
(0) on a number line. For absolute value functions, noticing where the argument of the absolute value bars will be zero can be helpful in ensuring that students graph correctly.
- For example, if students are asked to graph = | + 2|, students should recognize that the absolute value will be a V-shaped graph and the sharp bend will occur at the value of that makes the math statement of the function, | + 2|, equal to zero. Notice in the table below the value that makes the math statement zero is −2 and to graph using a table, students can choose values to the left and right of that critical value, −2.
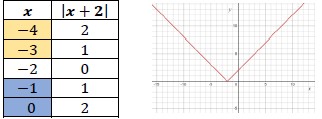
- For example, if students are asked to graph = | + 2|, students should recognize that the absolute value will be a V-shaped graph and the sharp bend will occur at the value of that makes the math statement of the function, | + 2|, equal to zero. Notice in the table below the value that makes the math statement zero is −2 and to graph using a table, students can choose values to the left and right of that critical value, −2.
- Instruction allows for the flexibility to graph absolute value functions using a variety of ways.
- For example, the function = | + 2| can be graphed using transformations, recognizing that this graph shifts two units to the left and will open upward because there’s a positive α value.
- For example, the function = | + 2| can be graphed by plotting points from the vertex, using the “slope.” In this case, once the vertex is plotted, as you travel 1 unit to the left and right you would go up one unit.
- For example, for the function = | + 2|, students can create a T-chart and solve for the values that satisfy the function. It is important that students include negative inputs in their T-chart so they are not misled as to what the graph looks like. Students can use their understanding of the parent function of = ||, whose v-shaped graph has a center of 0. In creating and plotting points, students will use the vertex to find the center of the graph and then choose additional point -values to use in the table to the left and right of the vertex.
- Instruction includes representing domain, range and constraints using words, inequality notation, set-builder notation and interval notation.
- Words
- If the domain is all real numbers, it can be written as “all real numbers” or “any value of , such that is a real number.”
- Inequality Notation
- If the domain is all values of greater than 2, it can be represented as > 2.
- Set-Builder Notation
- If the domain is all values of less than or equal to zero, it can be represented as {| ≤ 0} and is read as “all values of such that is less than or equal to zero.”
- Interval Notation
- If the domain is all values from 0 to infinity, including 0, it can be represented as [0, ∞).
- Words
- Depending on a student’s pathway, they may not have worked with interval notation (as that was not an expectation in Algebra I) before this course. Instruction includes making connections between inequality notation and interval notation.
- For example, if the range of a function is −10 < < 24, it can be represented in interval notation as (−10, 24). This is commonly referred to as an open interval because the interval does not contain the end values.
- For example, if the domain of a function is 0 ≤ ≤ 11.5, it can be represented in interval notation as [0, 11.5]. This is commonly referred to as a closed interval because the interval contains both end values.
- For example, if the domain of a function is 0 ≤ < 50, it can be represented in interval notation as [0, 50). This is commonly referred to as a half-open, or half-closed, interval because the interval contains only one of the end values.
- For example, if the range of a function is all real numbers, is can be represented in interval notation as (−∞, ∞). This is commonly referred to as an infinite interval because at least one of end values is infinity (positive or negative).
- Instruction includes the use of - notation and function notation for absolute value functions.
- Instruction includes making the connection to constraints (MA.912.AR.9.6) for a given context. Students should develop an understanding that absolute value graphs, without context, have no constraints on their domain and range. When specific contexts are modeled by absolute value functions, parts of the domain and range may not make sense and need to be removed, creating the need for constraints.
- Students should be given the opportunity to discuss how constraints can be written and adjusted based on the context they are given.
- Depending on a student’s pathway in the future, it will be important to understand that there is a relationship between piecewise functions and absolute value functions when working with derivatives or integration of functions (MTR.5.1).
- When addressing real-world contexts, the absolute value is used to define the difference or change from one point to another. Connect the graph of the function to the real-world context so the graph can serve as a model to represent the solution (MTR.6.1, MTR.7.1).
- Instruction includes the use of appropriately scaled coordinate planes, including the use of breaks in the - or -axis when necessary.
- Problem types include applying distance to real-world problems, showing how much a value deviates from the norm.
- Instruction includes opportunities for students to compare functions and show similarities between key features. It is also important that students see that the whole graph is symmetric across the vertex and if one point is found on one half of the graph, we can use its twin on the other half.
Common Misconceptions or Errors
- Students may think that distributive property should be used if a constant is in front of the absolute value.
- For example, for () = 4|−2|, students will incorrectly distribute the 4 to the absolute value function when evaluating.
- Students may not fully understand the connection of all of the key features (emphasize the use of technology to help with student discovery) and how to represent them using the proper notation.
Instructional Tasks
Instructional Task 1 (MTR.4.1, MTR.7.1)- Minivans, due to their size and purpose, are not typically very fuel-efficient vehicles. The
EPA’s estimates for fuel efficiency for the Toyota 2020 Sienna AWD is 14 city miles.
- Part A. Write a function that describes the Sienna’s estimated city miles per gallon fuel efficiency.
- Part B. Compare your function with a partner.
- Part C. Describe the graph of the function from Part A.
Instructional Task 2 (MTR.3.1, MTR.5.1)
- Part A. Graph () = −| −4|+2.
- Part B. Compare the graph from Part A to its parent function () = ||.
- Part C. Use the information from Part A and B to determine the domain and range of the function ().
Instructional Items
Instructional Item 1- Electrical parts, such as resistors and capacitors, come with specified values of their operating parameters: resistance, capacitance, etc. However, due to imprecision in manufacturing, the actual values of these parameters vary somewhat from piece to piece, even when they are supposed to be the same. The best that manufacturers can do is to try to guarantee that the variations will stay within a specified range, often ±1%, ±5% or ±10%. Suppose we have a resistor rated at 680 ohms, ±5%. Use an absolute value function to express the range of possible values of the actual resistance.
Instructional Item 2
- Graph the function () = −0.2| + 7|.
*The strategies, tasks and items included in the B1G-M are examples and should not be considered comprehensive.