
General Information
Subject Area: Mathematics (B.E.S.T.)
Grade: 912
Strand: Algebraic Reasoning
Standard: Write, solve and graph linear equations, functions and inequalities in one and two variables.
Date Adopted or Revised: 08/20
Status: State Board Approved
Benchmark Instructional Guide
Connecting Benchmarks/Horizontal Alignment
Terms from the K-12 Glossary
- Coordinate Plane
- Linear Expression
Vertical Alignment
Previous Benchmarks
Next Benchmarks
Purpose and Instructional Strategies
In grade 8, students wrote two-variable linear equations. In Algebra I, students write two variable linear inequalities. In later courses, students will solve problems involving linear programming and will write two-variable quadratic inequalities.- Instruction includes making connections to various forms of linear inequalities to show
their equivalency. Students should understand and interpret when one form might be
more useful than other depending on the context.
- Standard Form Can be described by the inequality + > , where , and are any rational number and any inequality symbol can be used. This form can be useful when identifying the - and -intercepts.
- Slope-Intercept Form Can be described by the inequality < + , where is the slope and is the -intercept and any inequality symbol can be used. This form can be useful when identifying the slope and -intercept.
- Point-Slope Form Can be described by the inequality − 1 ≤ ( − 1), where (1, 1) are a point on the boundary line and m is the slope of the line and any inequality symbol can be used. This form can be useful when the -intercept is not readily apparent.
- Look for opportunities to point out the connection between linear contexts and constant rates of change.
- Problem types should include cases for vertical and horizontal lines.
- Instruction includes the connection to one-variable linear inequalities and their solutions
on a number line.
- For example, provide the inequality ≥ 2 and a coordinate plane for students to determine points that satisfy the inequality. Students will determine that all points on the half-plane to the right of = 2 contain solutions.
Common Misconceptions or Errors
- Students often choose the incorrect inequality symbol when interpreting graphs or contexts. Help these students develop the habit of using a test point to check their work. Any point can be used, but many students find it easiest to use the origin (0, 0) as it often makes mental calculation much quicker.
- When creating inequalities, students may confuse the phrase “less than.”
- For example, students interpreting the phrase “eight less than four times a number” (4 − 8) could incorrectly model it as 8 − 4 or 8 < 4.
Strategies to Support Tiered Instruction
- Instruction includes opportunities to use a highlighter to identify the phrases “is less than,” “is greater than,” “is less than or equal to,” and “is greater than or equal to” when writing inequalities.
- Instruction includes opportunities to identify a test point to plug into an inequality to
determine which symbol should be used when writing the inequality. It is usually easiest
to use the origin (0,0) as it makes mental calculations easier. If the point selected creates
a true statement, their inequality is true. If it creates a false statement, their inequality is
false.
- For example, given the graph below, one could use the test point (0,0) to determine whether the inequality y ≤ + 3 or ≥ + 3 represents the graph. When plugging in (0,0) for ≥ + 3, it results in the inequality 0 ≥ 3 which is a false statement. When plugging in (0,0) for ≤ + 3, it results in the equality 0 ≤ 3 which is a true statement. Therefore, the inequality ≤ +
3 represents the given graph.
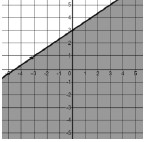
Instructional Tasks
Instructional Task 1 (MTR.7.1)- A carpenter makes two types of chairs: a lawn chair and a living room chair. It takes her 3
hours to make a lawn chair and 5 hours to make a living room chair.
- Part A. If the carpenter works a maximum of 55 hours per week, write a two-variable linear inequality to describe the number of possible chairs of each type she can make in a week.
- Part B. What is one possible combination of lawn chair and living room chair that the carpenter can make in one week?
- Part C. What is one possible combination of lawn chair and living room chair that the carpenter could make in one month?
Instructional Task 2 (MTR.3.1, MTR.4.1)
- The graph of the solution set to a linear inequality is shown below.
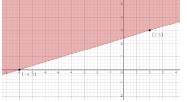
- Part A. Create a linear inequality that corresponds to this graph.
- Part B. Create a real-world situation that could be described by the graph and the inequality created in Part A.
Instructional Items
Instructional Item 1- The graph of the solution set to a linear inequality is shown below. Create a linear inequality that corresponds to this graph.
*The strategies, tasks and items included in the B1G-M are examples and should not be considered comprehensive.