
General Information
Subject Area: Mathematics (B.E.S.T.)
Grade: 912
Strand: Algebraic Reasoning
Standard: Write, solve and graph linear equations, functions and inequalities in one and two variables.
Date Adopted or Revised: 08/20
Status: State Board Approved
Benchmark Instructional Guide
Connecting Benchmarks/Horizontal Alignment
Terms from the K-12 Glossary
- Coordinate Plane
- Domain
- Function Notation
- Range
- Rate of Change
- Slope
- -intercept
- -intercept
Vertical Alignment
Previous Benchmarks
Next Benchmarks
Purpose and Instructional Strategies
In grade 8, students determined and interpreted the slope and -intercept of a two-variable linear equation in slope-intercept form from a real-world context. In Algebra I, students solve real-world problems that are modeled with linear functions when given equations in all forms, as well as tables and written descriptions, and they determine and interpret the domain, range and other key features. Students will additionally, interpret key features and identify any constraints. In later courses, students will graph and solve problems involving linear programming, systems of equations in three variables and piecewise functions.- This benchmark is a culmination of MA.912.AR.2. Instruction here should feature a variety of real-world contexts.
- Instruction includes representing domain, range and constraints using words, inequality
notation and set-builder notation.
- Words
- If the domain is all real numbers, it can be written as “all real numbers” or “any value of , such that is a real number.”
- Inequality Notation
- If the domain is all values of greater than 2, it can be represented as > 2.
- Set-Builder Notation
- If the domain is all values of less than or equal to zero, it can be represented as {| ≤ 0} and is read as “all values of such that is less than or equal to zero.”
- Words
- Instruction includes the use of - notation and function notation.
- This benchmark presents the first opportunity for students to represent constraints in the domain and range of functions. Students should develop an understanding that linear graphs, without context, have no constraints on their domain and range. When specific contexts are modeled by linear functions, parts of the domain and range may not make sense and need to be removed, creating the need for constraints.
- Instruction includes the understanding that a real-world context can be represented by a
linear two-variable equation even though it only has meaning for discrete values.
- For example, if a gym membership cost $10.00 plus $6.00 for each class, this can be represented as = 10 + 6. When represented on the coordinate plane, the relationship is graphed using the points (0,10), (1,16), (2,22), and so on.
- For mastery of this benchmark, students should be given flexibility to represent real-world contexts with discrete values as a line or as a set of points.
- Instruction directs students to graph or interpret a representation of a context that necessitates a constraint. Discuss the meaning of multiple points on the line and announce their meanings in the associated context (MTR.4.1). Allow students to discover that some points do not make sense in context and therefore should not be included in a formal solution (MTR.6.1). Ask students to determine which parts of the line create sensible solutions and guide them to make constraints to represent these sections.
- Instruction includes the use of technology to develop the understanding of constraints.
- Instruction includes the connection to scatter plots and lines of fit (MA.912.DP.2.4) and the connection to systems of equations or inequalities (MA.912.DP.9.6).
Common Misconceptions or Errors
- Students may express initial confusion with the meaning of () for functions written in function notation.
- Students may assign their constraints to the incorrect variable.
- Students may miss the need for compound inequalities in their constraints. Students may
not include zero as part of the domain or range.
- For example, if a constraint for the domain is between 0 and 10, a student may forget to include 0 in some contexts, since they may assume that one cannot have zero people, for instance.
Strategies to Support Tiered Instruction
- Teacher provides equations in both function notation and - notation written in slope-intercept form and models graphing both forms using a graphing tool or graphing
software (MTR.2.1).
- For example, () = + 6 and = + 6, to show that both () and represent the same outputs of the function.
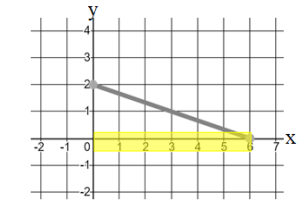
- Instruction provides opportunities for identifying the domain and range on the - and -
axis respectively using a highlighter.
- For example, Tim bought 2 cubic feet of fertilizer and uses a little everyday on his lawn for 6 months, and the amount of fertilizer decreases at a constant rate as shown on the graph. The domain of the function in this context is 0 ≤ ≤ 6.
- Teacher provides context to visualize and determine if it would make sense for the
function to extend to a given area.
- For example, if Garrison bought a house in 2014 and the price increases at a constant rate, he can model this by graphing a linear function where represents the time since 2014. The domain could include negative values if he wanted to show the estimated price of the house before 2014.
- For example, if the temperature in Alaska is at 14 degrees Fahrenheit at 6:00 am and drops at a constant rate, this can be modeled by graphing a linear function where represents the time since 6:00 am. The range could include negative numbers to show the temperature below 0 degrees Fahrenheit.
Instructional Tasks
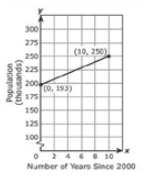
Instructional Task 1 (MTR.7.1)- The population of St. Johns County, Florida, from the year 2000 through 2010 is shown in the graph below. If the trend continues, what will be the population of St. Johns County in 2025?
- Devon is attending a local festival downtown. He plans to park his car in a parking garage
that operates from 7:00 a.m. to 10:00 p.m. and charges $5 for the first hour and $2 for each
additional hour of parking.
- Part A. Create a linear graph that represents the relationship between the price and number of hours parked.
- Part B. What is an appropriate domain and range for the given situation?
Instructional Items
Instructional Item 1- Suppose you fill your truck’s tank with fuel and begin driving down the highway for a road
trip. Assume that, as you drive, the number of minutes since you filled the tank and the
number of gallons remaining in the tank are related by a linear function. After 40 minutes,
you have 28.4 gallons left. An hour after filling up, you have 26.25 gallons left.
- Part A. Graph this relationship.
- Part B. Determine how many hours it will take for you to run out of fuel.