
General Information
Subject Area: Mathematics (B.E.S.T.)
Grade: 8
Strand: Functions
Standard: Define, evaluate and compare functions.
Date Adopted or Revised: 08/20
Status: State Board Approved
Benchmark Instructional Guide
Connecting Benchmarks/Horizontal Alignment
Terms from the K-12 Glossary
- Function
Vertical Alignment
Previous Benchmarks
Next Benchmarks
Purpose and Instructional Strategies
In grade 7, students determined one of the key features of a proportional relationship, its constant of proportionality, from its graph. In grade 8, students determine where a function is increasing or decreasing from its graph. In Algebra 1, students will compare key features of linear and nonlinear functions represented algebraically, graphically, in tables or written descriptions.- Graphs can be described many ways. Using knowledge of functions, equations, and graphs, students should be able to describe a graph in words and should be able to draw a graph if given a qualitative description.
- When working with graphs, instruction includes students reasoning through asking questions such as:
- Does the graph represent a function?
- Does the graph show increase, decrease, both, or neither?
- Are there intervals of the domain in which the graph shows that the function increases, decreases, or stays constant?
- Does the graph represent a linear function?
- What is the (approximate) slope of a given interval within the graph?
- Students should be given opportunities to analyze graphs individually and with others (MTR.4.1).
- When sketching a graph based on a written description, students may use curved or straight lines to represent portions of increase or decrease based on the description.
- Problems where students are creating a graph are note expected to differentiate between linear and nonlinear functions to represent the written description.
- For example, if the description has a rapid increase, a student can sketch a curve that increases rapidly or a straight line with a steep slope.
- For example, in grade 8 students are not expected to recognize curves that represent exponential growth or decay.
Common Misconceptions or Errors
- Students may invert domain and range.
- Students may incorrectly describe increasing, decreasing or constant intervals using elements outside of the domain.
Strategies to Support Tiered Instruction
- Teacher reviews vocabulary and the difference between the terms. Once students understand that domain represents the input variable (independent variable), they can make sense of real-world problems to accurately identify domain and range.
- Teacher poses questions to encourage discourse to gain information about graphs. Students have the opportunity to discuss what they see and know from the graph and have the ability to make inferences about its description.
- Instruction includes providing real-world situations and having the students identify domain and range for the situation, giving justification as to their reasoning. Students can create their own situation and identify the domain and range for their situation.
- Teacher provides examples of different characteristics of graphs. Once students can identify basic attributes of the graphs, they can begin to reason through more specific questions about each graph.
- For example, describing if the graph is increasing or decreasing, if the graph is a linear function, if the graph is a function, what is the slope of the graph (if linear), etc.
- Instruction includes creating an anchor chart with students describing increasing, decreasing, or constant graph.
Instructional Tasks
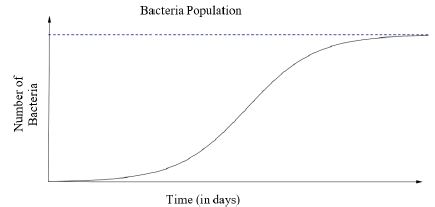
Instructional Task 1 (MTR.6.1)The graph describes the number of bacteria in a culture over time.
Instructional Items
Instructional Item 1Sketch a graph of the representation described below.
Madison is studying the growth of bacteria in food and learned it has four phases. Label the axes and show a graph of the four stages, assuming an initial bacterium count of 50.
Phase 1: No growth in the number of cells for the first hour.
Phase 2: Rapid growth in the number of bacteria for the next two hours.
Phase 3: Growth stops for one hour as nutrients are used up and waste accumulates.
Phase 4: All bacteria gradually die off during the final four-hour phase.
*The strategies, tasks and items included in the B1G-M are examples and should not be considered comprehensive.