
General Information
Subject Area: Mathematics (B.E.S.T.)
Grade: 8
Strand: Functions
Standard: Define, evaluate and compare functions.
Date Adopted or Revised: 08/20
Status: State Board Approved
Benchmark Instructional Guide
Connecting Benchmarks/Horizontal Alignment
Terms from the K-12 Glossary
- Function
- Linear Function
Vertical Alignment
Previous Benchmarks
Next Benchmarks
Purpose and Instructional Strategies
In grade 7, students determined whether a relationship was proportional, given a table, equation or written description. In grade 8, students determine whether the function defined by a graph or an equation is a linear function. In Algebra 1, students will classify the function type given an equation or graph and compare key features of linear and nonlinear functions.- Instruction includes determining if the function has a constant rate of change between the - and -values.
- For example, students can depict the rate of change between the values in a table like below.
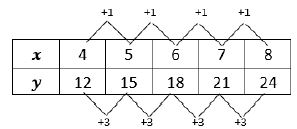
- For example, students can depict the rate of change between the values in a table like below.
- Instruction includes a focus on the connection between the equation and the graph.
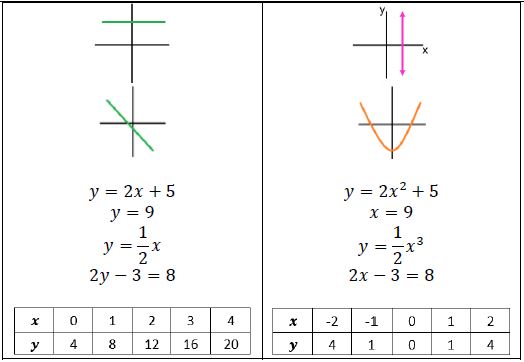
- Students should develop an understanding of a linear function by using examples and non-examples.

Common Misconceptions or Errors
- Students may not understand the connection from a table to the visual of a graph of the same function. To address this misconception, provide opportunities for students to make connections and see the graph and table side by side.
Strategies to Support Tiered Instruction
- Teacher models how to get from a set of points displayed on a table to the points graphed on a coordinate plane, and how points from a coordinate plan can be written in a table. Then, teacher provides opportunities to notice any patterns in the graph or table that will help identify if the function is linear.
- Teacher co-constructs a graph from a table with students, as well as a table from a graph to increase understanding of the relationship between the two. Once students become comfortable moving between graphs and tables, students can begin inspecting tables that represent functions. Teachers can review proportional and linear relationships and work with students to dissect tables to find if they contain a proportional relationship, meaning they are linear. Students should note that not all linear relationships are proportional, but all proportional relationships are linear.
- Teacher provides opportunities for students to make connections and see the graph and table of the same function side by side.
Instructional Tasks
Instructional Task 1 (MTR.6.1)The area, , of an isosceles right triangle is a function of the length of its legs, , and is represented by the equation = 0.5².
- Part A. Create a table of values to represent this function.
- Part B. Plot the points on a coordinate plane.
- Part C. What is the domain and range of the function?
- Part D. Is this function linear or nonlinear? Explain and justify your answer.
Instructional Task 2 (MTR.2.1)
Part A. Create a table that could represent a linear function.
Part B. Create a table that could represent a non-linear function.
Part C. Compare your table from Part B with a partner.
Taro and Jiro climbed a mountain and hiked back down. At the summit and at every station along the way back down, they recorded their altitude and the amount of time they had been travelling. Can the data in the table represent a linear function?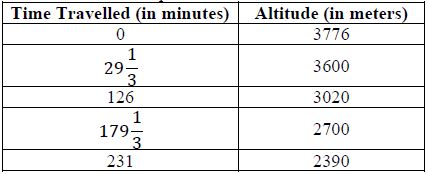
Instructional Item 2
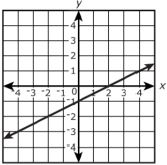
Does the graph below represent a linear function? If so, justify your answer.
Part B. Create a table that could represent a non-linear function.
Part C. Compare your table from Part B with a partner.
Instructional Items
Instructional Item 1Taro and Jiro climbed a mountain and hiked back down. At the summit and at every station along the way back down, they recorded their altitude and the amount of time they had been travelling. Can the data in the table represent a linear function?
Instructional Item 2
Does the graph below represent a linear function? If so, justify your answer.
*The strategies, tasks and items included in the B1G-M are examples and should not be considered comprehensive.