Given a mathematical or real-world context, graph a two-variable linear equation from a written description, a table or an equation in slope-intercept form.
| Name |
Description |
| Seeing the Slope | This 5E lesson will build on students' prior knowledge of positive proportional relationships and graphing them. It will introduce students to negative values of slopes, which will lead to graphing negative proportional relationships. Students will discover properties of different values of slope and have the opportunity to practice graphing. This lesson is designed to be done in a 50-minute block. |
| Compacting Cardboard | Students investigate the amount of space that could be saved by flattening cardboard boxes. The analysis includes linear graphs and regression analysis along with discussions of slope and a direct variation phenomenon. |
| Cat Got Your Tongue? | This lesson uses real-world examples to practice interpreting the slope and y-intercept of a linear model in the context of data. Students will collect data, graph a scatter plot, and use spaghetti to identify a line of fit. A PowerPoint is included for guidance throughout the lesson and guided notes are also provided for students. |
| Fundamental Property of Reflections | This lesson helps students discover that in a reflection, the line of reflection is the perpendicular bisector of any segment connecting any pre-image point with its reflected image. |
| If the line fits, where's it? | In this lesson students learn how to informally determine a "best fit" line for a scatter plot by considering the idea of closeness. |
| Scrambled Coefficient | Students will learn how the correlation coefficient is used to determine the strength of relationships among real data. Students use card sorting to order situations from negative to positive correlations. Students will create a scatter plot and use technology to calculate the line of fit and the correlation coefficient. Students will make a prediction and then use the line of fit and the correlation coefficient to confirm or deny their prediction.
Students will learn how to use the Linear Regression feature of a graphing calculator to determine the line of fit and the correlation coefficient.
The lesson includes the guided card sorting task, a formative assessment, and a summative assessment. |
| Slippery Slopes | This lesson will not only reinforce students understanding of slope and y-intercept, but will also ensure the students understand how it can be modeled in a real world situation. The focus of this lesson is to emphasize that slope is a rate of change and the y-intercept the value of y when x is zero. Students will be able to read a problem and create a linear equation based upon what they read. They will then make predictions based upon this information. |
| In the Real World | This resource provides a Lesson Plan for teaching students how to analyze real-world problems to look for clearly identified values and determine which of them is a constant value and which of them is subject to change (will increase or decrease per unit of time, weight, length, etc.). The students will also be taught how to determine the correct units for each value in an equation written in slope-intercept form. |
| The Speeding Ticket: Part 2 - Graphing Linear Functions | This lesson allows the student to learn about dependent and independent variables and how to make the connection between the linear equation, a linear function, and its graph. The student will learn graphing relationships and how to identify linear functions. |
| Put Your Money Where Your Mouth Is | Students will learn to find the solutions to a system of linear equations, by graphing the equations. |
| Exploring Slope Intercept Form with Graphs and Physical Activity | Students will work in pairs and compose three different linear equations in slope intercept form. They will discover and describe how different values for the slope and y-intercept affect the graph. After graphing lines on graph paper, they will do a physical activity involving graphing. |
| Graphing Equations on the Cartesian Plane: Slope | The lesson teaches students about an important characteristic of lines: their slope. Slope can be determined either in graphical or algebraic form. Slope can also be described as positive, negative, zero, or undefined. Students get an explanation of when and how these different types of slopes occur. Finally, students learn how slope relates to parallel and perpendicular lines. When two lines are parallel, they have the same slope and when they are perpendicular their slopes are negative reciprocals of one another.
Prerequisite knowledge: Students must know how to graph points on the Cartesian plane. They must be familiar with the x- and y-axis on the plane in both the positive and negative directions. |
| When Will We Ever Meet? | Students will be guided through the investigation of y = mx+b. Through this lesson, students will be able to determine whether lines are parallel, perpendicular, or neither by looking at the graph and the equation. |
| Movie Theater MEA | In this Model Eliciting Activity, MEA, students create a plan for a movie theater to stay in business. Data is provided for students to determine the best film to show, and then based on that decision, create a model of ideal sales. Students will create equations and graph them to visually represent the relationships.
Model Eliciting Activities, MEAs, are open-ended, interdisciplinary problem-solving activities that are meant to reveal students’ thinking about the concepts embedded in realistic situations. Click here to learn more about MEAs and how they can transform your classroom. |
| Scatter plots, spaghetti, and predicting the future | Students will construct a scatter plot from given data. They will identify the correlation, sketch an approximate line of fit, and determine an equation for the line of fit. They will explain the meaning of the slope and y-intercept in the context of the data and use the line of fit to interpolate and extrapolate values. |
| Name |
Description |
| Sore Throats, Variation 2 | Students graph proportional relationships and understand the unit rate as a measure of the steepness of the related line, called the slope. Students will also treat slopes more formally when they graph proportional relationships and interpret the unit rate as the slope of the graph. |
| Who Has the Best Job? | This task asks the student to graph and compare two proportional relationships and interpret the unit rate as the slope of the graph. Students are also asked to write an equation and graph each scenario. |
| Coffee by the Pound | Students will answer questions about unit price of coffee, make a graph of the information, and explain the meaning of constant of proportionality/slope in the given context. |
| Battery Charging | This task has students engaging in a simple modeling exercise, taking verbal and numerical descriptions of battery life as a function of time and writing down linear models for these quantities. To draw conclusions about the quantities, students have to find a common way of describing them. |
| Introduction to Linear Functions | This task lets students explore the differences between linear and non-linear functions. By contrasting the two, it reinforces properties of linear functions. |
| Comparing Speeds in Graphs and Equations | This task provides the opportunity for students to reason about graphs, slopes, and rates without having a scale on the axes or an equation to represent the graphs. Students who prefer to work with specific numbers can write in scales on the axes to help them get started. |
| Chicken and Steak, Variation 1 | In this problem-solving task students are challenged to apply their understanding of linear relationships to determine the amount of chicken and steak needed for a barbecue, which will include creating an equation, sketching a graph, and interpreting both. This resource also includes annotated solutions. |
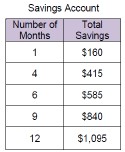
| Kimi and Jordan | Students are asked to create and graph linear equations to compare the savings of two individuals. The purpose of the table in (a) is to help students complete (b) by noticing regularity in the repeated reasoning required to complete the table. |
| Distance Across the Channel | This problem-solving task asks students to find a linear function that models something in the real world. After finding the equation of the linear relationship between the depth of the water and the distance across the channel, students have to verbalize the meaning of the slope and intercept of the line in the context of this situation. Commentary and illustrated solutions are included. |
| Name |
Description |
| Who Has the Best Job?: | This task asks the student to graph and compare two proportional relationships and interpret the unit rate as the slope of the graph. Students are also asked to write an equation and graph each scenario. |
| Coffee by the Pound: | Students will answer questions about unit price of coffee, make a graph of the information, and explain the meaning of constant of proportionality/slope in the given context. |
| Introduction to Linear Functions: | This task lets students explore the differences between linear and non-linear functions. By contrasting the two, it reinforces properties of linear functions. |
| Comparing Speeds in Graphs and Equations: | This task provides the opportunity for students to reason about graphs, slopes, and rates without having a scale on the axes or an equation to represent the graphs. Students who prefer to work with specific numbers can write in scales on the axes to help them get started. |
| Chicken and Steak, Variation 1: | In this problem-solving task students are challenged to apply their understanding of linear relationships to determine the amount of chicken and steak needed for a barbecue, which will include creating an equation, sketching a graph, and interpreting both. This resource also includes annotated solutions. |
| Kimi and Jordan: | Students are asked to create and graph linear equations to compare the savings of two individuals. The purpose of the table in (a) is to help students complete (b) by noticing regularity in the repeated reasoning required to complete the table. |
| Distance Across the Channel: | This problem-solving task asks students to find a linear function that models something in the real world. After finding the equation of the linear relationship between the depth of the water and the distance across the channel, students have to verbalize the meaning of the slope and intercept of the line in the context of this situation. Commentary and illustrated solutions are included. |
| Name |
Description |
| Sore Throats, Variation 2: | Students graph proportional relationships and understand the unit rate as a measure of the steepness of the related line, called the slope. Students will also treat slopes more formally when they graph proportional relationships and interpret the unit rate as the slope of the graph. |
| Who Has the Best Job?: | This task asks the student to graph and compare two proportional relationships and interpret the unit rate as the slope of the graph. Students are also asked to write an equation and graph each scenario. |
| Coffee by the Pound: | Students will answer questions about unit price of coffee, make a graph of the information, and explain the meaning of constant of proportionality/slope in the given context. |
| Battery Charging: | This task has students engaging in a simple modeling exercise, taking verbal and numerical descriptions of battery life as a function of time and writing down linear models for these quantities. To draw conclusions about the quantities, students have to find a common way of describing them. |
| Introduction to Linear Functions: | This task lets students explore the differences between linear and non-linear functions. By contrasting the two, it reinforces properties of linear functions. |
| Comparing Speeds in Graphs and Equations: | This task provides the opportunity for students to reason about graphs, slopes, and rates without having a scale on the axes or an equation to represent the graphs. Students who prefer to work with specific numbers can write in scales on the axes to help them get started. |
| Chicken and Steak, Variation 1: | In this problem-solving task students are challenged to apply their understanding of linear relationships to determine the amount of chicken and steak needed for a barbecue, which will include creating an equation, sketching a graph, and interpreting both. This resource also includes annotated solutions. |
| Kimi and Jordan: | Students are asked to create and graph linear equations to compare the savings of two individuals. The purpose of the table in (a) is to help students complete (b) by noticing regularity in the repeated reasoning required to complete the table. |
| Distance Across the Channel: | This problem-solving task asks students to find a linear function that models something in the real world. After finding the equation of the linear relationship between the depth of the water and the distance across the channel, students have to verbalize the meaning of the slope and intercept of the line in the context of this situation. Commentary and illustrated solutions are included. |

 is incorrectly written as
  .
.